30
/
AIzaSyAYiBZKx7MnpbEhh9jyipgxe19OcubqV5w
April 1, 2024
282833
Vietnam
VNM
true
2
1
PPG, IDA (AMT, current US$)
2016,2015,2014,2013,2012,2011,2010,2009,2008,2007,2006,2005,2004,2003,2002,2001,2000,1999,1998,1997,1996,1995,1994,1993,1992,1991,1990
Public Timelines
FAQ
Menu
Public Timelines
FAQ
Public Timelines
FAQ
For education
For educational institutions
For teachers
For students
Open cabinet
For educational institutions
For teachers
For students
Open cabinet
Create
Close
Create a timeline
Public timelines
Library
FAQ
Download
Global statistics library
→
Vietnam
→
PPG, IDA (AMT, current US$)
This statistics in other country:
Afghanistan
Albania
Angola
Armenia
Azerbaijan
Bangladesh
Benin
Bhutan
Bolivia
Bosnia and Herzegovina
Botswana
Burkina Faso
Burundi
Cabo Verde
Cambodia
Cameroon
Central African Republic
Chad
China
Colombia
Comoros
Congo, Dem. Rep.
Congo, Rep.
Costa Rica
Cote d'Ivoire
Djibouti
Dominica
Dominican Republic
East Asia & Pacific (excluding high income)
Ecuador
Egypt, Arab Rep.
El Salvador
Eritrea
Ethiopia
Europe & Central Asia (excluding high income)
Gambia, The
Georgia
Ghana
Grenada
Guinea
Guinea-Bissau
Guyana
Haiti
Honduras
IDA only
India
Indonesia
Jordan
Kenya
Kosovo
Kyrgyz Republic
Lao PDR
Latin America & Caribbean (excluding high income)
Lesotho
Liberia
Low & middle income
Low income
Lower middle income
Macedonia, FYR
Madagascar
Malawi
Maldives
Mali
Mauritania
Mauritius
Middle East & North Africa (excluding high income)
Middle income
Moldova
Mongolia
Montenegro
Morocco
Mozambique
Myanmar
Nepal
Nicaragua
Niger
Nigeria
Pakistan
Papua New Guinea
Paraguay
Philippines
Rwanda
Samoa
Sao Tome and Principe
Senegal
Serbia
Sierra Leone
Solomon Islands
Somalia
South Asia
Sri Lanka
St. Lucia
St. Vincent and the Grenadines
Sub-Saharan Africa (excluding high income)
Sudan
Swaziland
Syrian Arab Republic
Tajikistan
Tanzania
Thailand
Togo
Tonga
Tunisia
Turkey
Uganda
Upper middle income
Uzbekistan
Vanuatu
Vietnam
Yemen, Rep.
Zambia
Zimbabwe
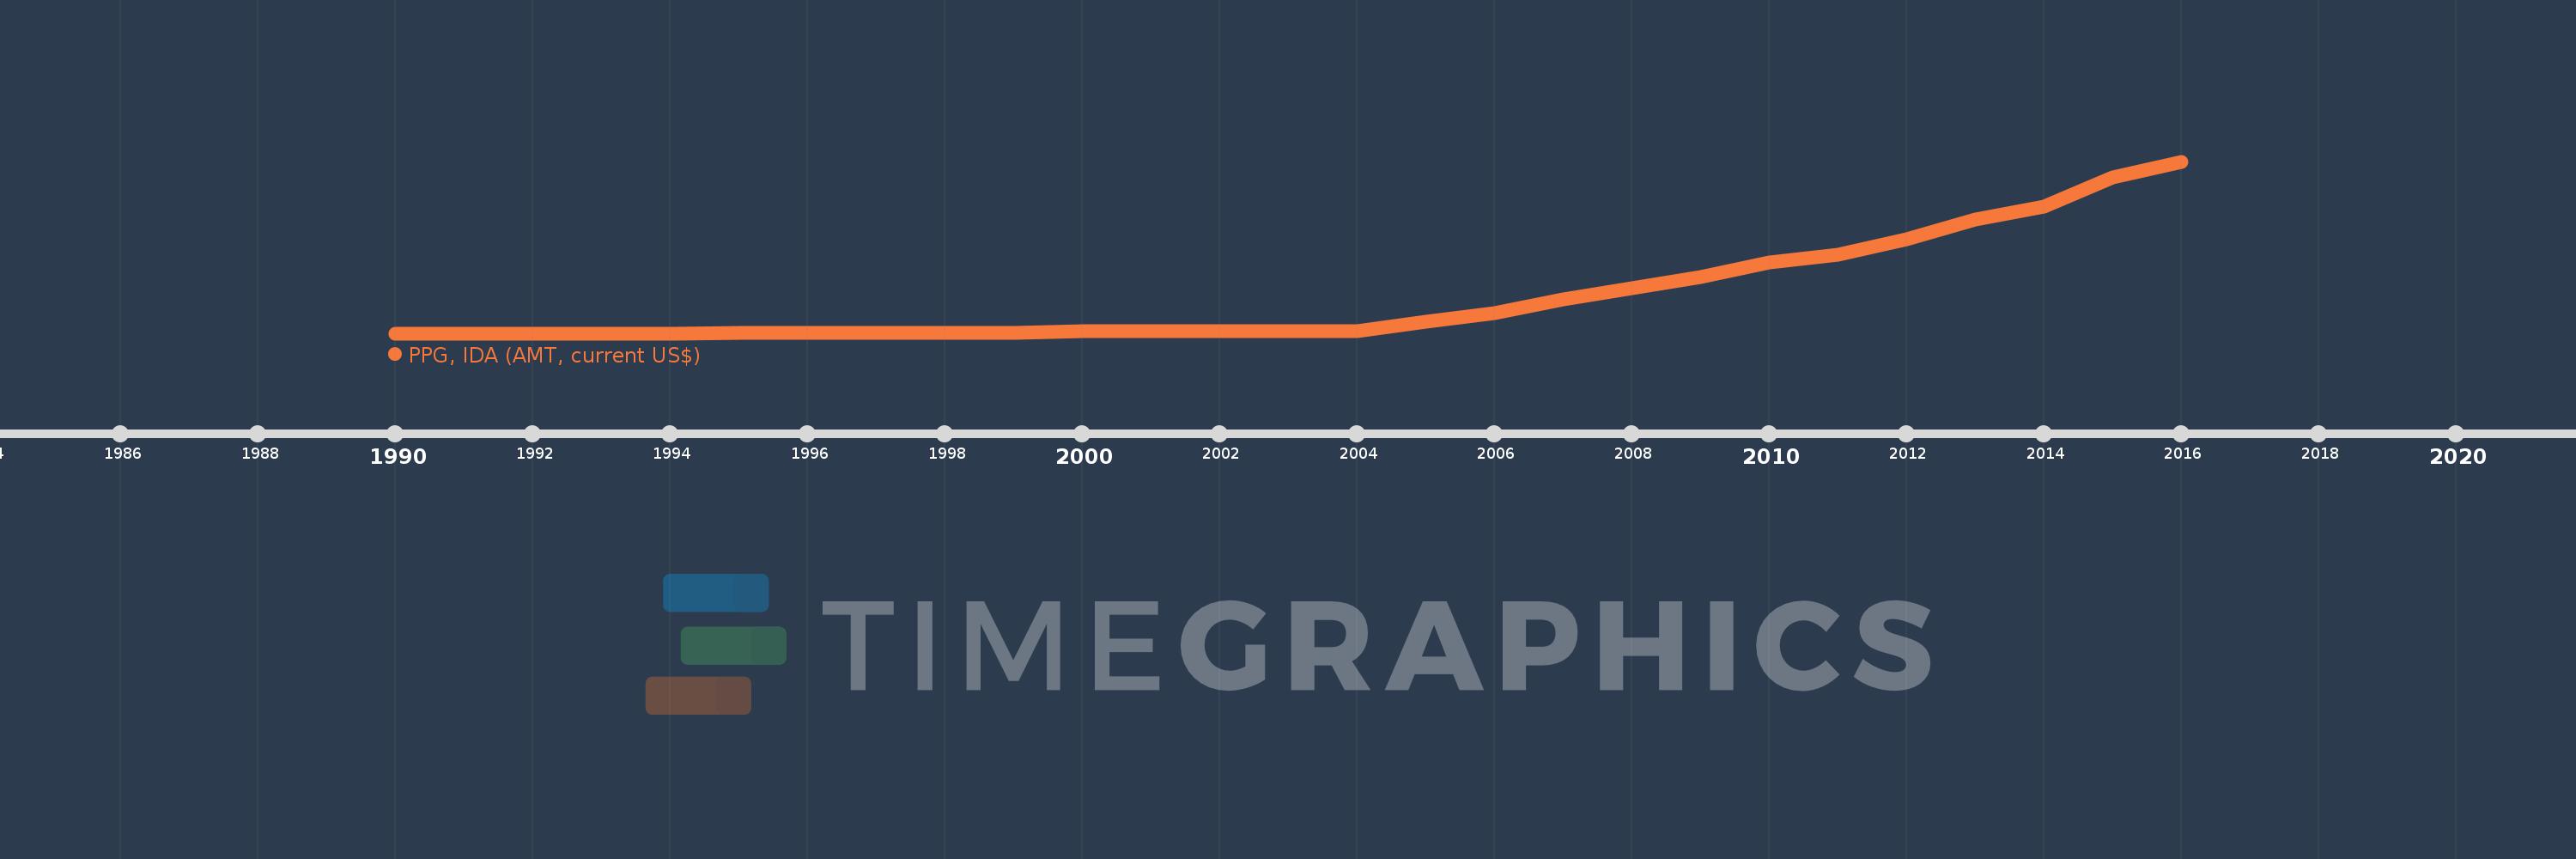
Timeline:
This timeline shows a graph from
1990
to
2016
of Vietnam. No data until
1989
. Number of actual observations by date:
27
.
Source name:
World Development Indicators
Source organization:
World Bank, International Debt Statistics.
Categories, topics:
External Debt
Last updated:
apr 23, 2017
Indicators value changes by year
Meaning:
24.57 mln
Minimum:
596.0K
jan 1, 1990
Maximum:
113.107 mln
jan 1, 2016
At the date of observation
Value
Absolute change
Change from the previous value
jan 1, 1990
596.0K
+596.0K
0.0%
jan 1, 1991
596.0K
0.0
0.0%
jan 1, 1992
596.0K
0.0
0.0%
jan 1, 1993
596.0K
0.0
0.0%
jan 1, 1994
596.0K
0.0
0.0%
jan 1, 1995
597.0K
+1000.0
0.17%
jan 1, 1996
597.0K
0.0
0.0%
jan 1, 1997
597.0K
0.0
0.0%
jan 1, 1998
597.0K
0.0
0.0%
jan 1, 1999
597.0K
0.0
0.0%
jan 1, 2000
1.791 mln
+1.194 mln
200.0%
jan 1, 2001
1.791 mln
0.0
0.0%
jan 1, 2002
1.791 mln
0.0
0.0%
jan 1, 2003
1.791 mln
0.0
0.0%
jan 1, 2004
1.791 mln
0.0
0.0%
jan 1, 2005
8.155 mln
+6.364 mln
355.33%
jan 1, 2006
13.558 mln
+5.403 mln
66.25%
jan 1, 2007
23.019 mln
+9.461 mln
69.78%
jan 1, 2008
30.337 mln
+7.318 mln
31.79%
jan 1, 2009
37.41 mln
+7.073 mln
23.31%
jan 1, 2010
46.965 mln
+9.555 mln
25.54%
jan 1, 2011
52.06 mln
+5.095 mln
10.85%
jan 1, 2012
62.44 mln
+10.38 mln
19.94%
jan 1, 2013
75.273 mln
+12.833 mln
20.55%
jan 1, 2014
83.652 mln
+8.379 mln
11.13%
jan 1, 2015
102.504 mln
+18.852 mln
22.54%
jan 1, 2016
113.107 mln
+10.603 mln
10.34%
Ranking of countries by current statistics by years
About & Feedback
Terms
Privacy
Library
2024
©
Time.Graphics
Support 24/7
Cabinet
Get premium
Donate
The service accepts bank transfer (ACH, Wire) or cards (Visa, MasterCard, etc). Processed by Stripe.
Secured with SSL
Excellent (Trustpilot Reviews)
Based on 115+ reviews
Write your own review on
Trustpilot.com
