29
/
en
AIzaSyAYiBZKx7MnpbEhh9jyipgxe19OcubqV5w
April 1, 2024
251250
St. Lucia
LCA
true
2
1
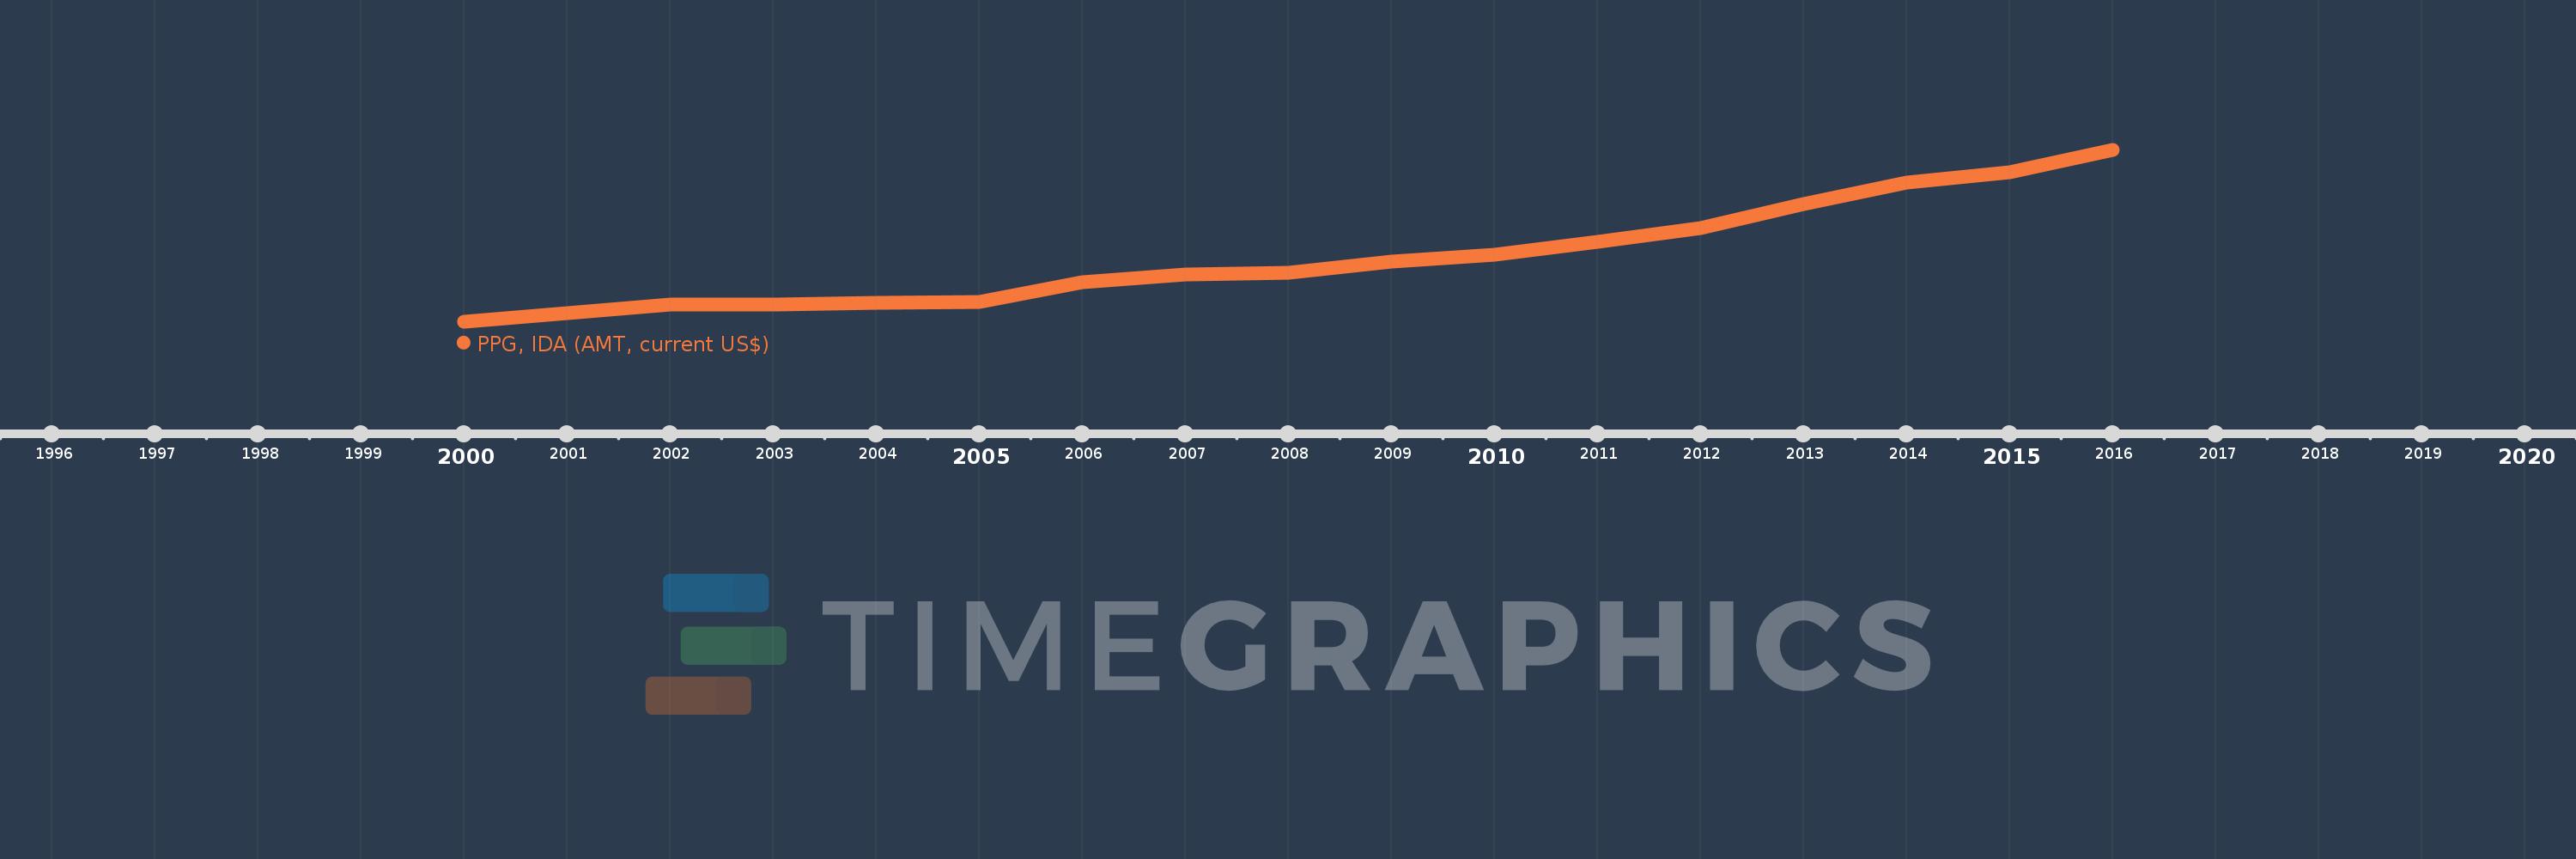
PPG, IDA (AMT, current US$)
2016,2015,2014,2013,2012,2011,2010,2009,2008,2007,2006,2005,2004,2003,2002,2001,2000
This statistics in other country:
Timeline:
This timeline shows a graph from 2000 to 2016 of St. Lucia. No data until 1999. Number of actual observations by date: 17.
Source name:
World Development Indicators
Source organization:
World Bank, International Debt Statistics.
Categories, topics:
External Debt
Last updated:
apr 23, 2017
Indicators value changes by year
Maximum:
1.263 mln
jan 1, 2016
At the date of observation
Value
Absolute change
Change from previous value
jan 1, 2001
66.0K
+66.0K
%
jan 1, 2002
128.0K
+62.0K
93.94%
jan 1, 2003
128.0K
0.0
0.0%
jan 1, 2004
139.0K
+11.0K
8.59%
jan 1, 2005
147.0K
+8.0K
5.76%
jan 1, 2006
294.0K
+147.0K
100.0%
jan 1, 2007
351.0K
+57.0K
19.39%
jan 1, 2008
364.0K
+13.0K
3.7%
jan 1, 2009
441.0K
+77.0K
21.15%
jan 1, 2010
496.0K
+55.0K
12.47%
jan 1, 2011
589.0K
+93.0K
18.75%
jan 1, 2012
691.0K
+102.0K
17.32%
jan 1, 2013
867.0K
+176.0K
25.47%
jan 1, 2014
1.027 mln
+160.0K
18.45%
jan 1, 2015
1.1 mln
+73.0K
7.11%
jan 1, 2016
1.263 mln
+163.0K
14.82%
Ranking of countries by current statistics by years


Comments: