29
/
en
AIzaSyAYiBZKx7MnpbEhh9jyipgxe19OcubqV5w
April 1, 2024
63961
Afghanistan
AFG
true
2
1
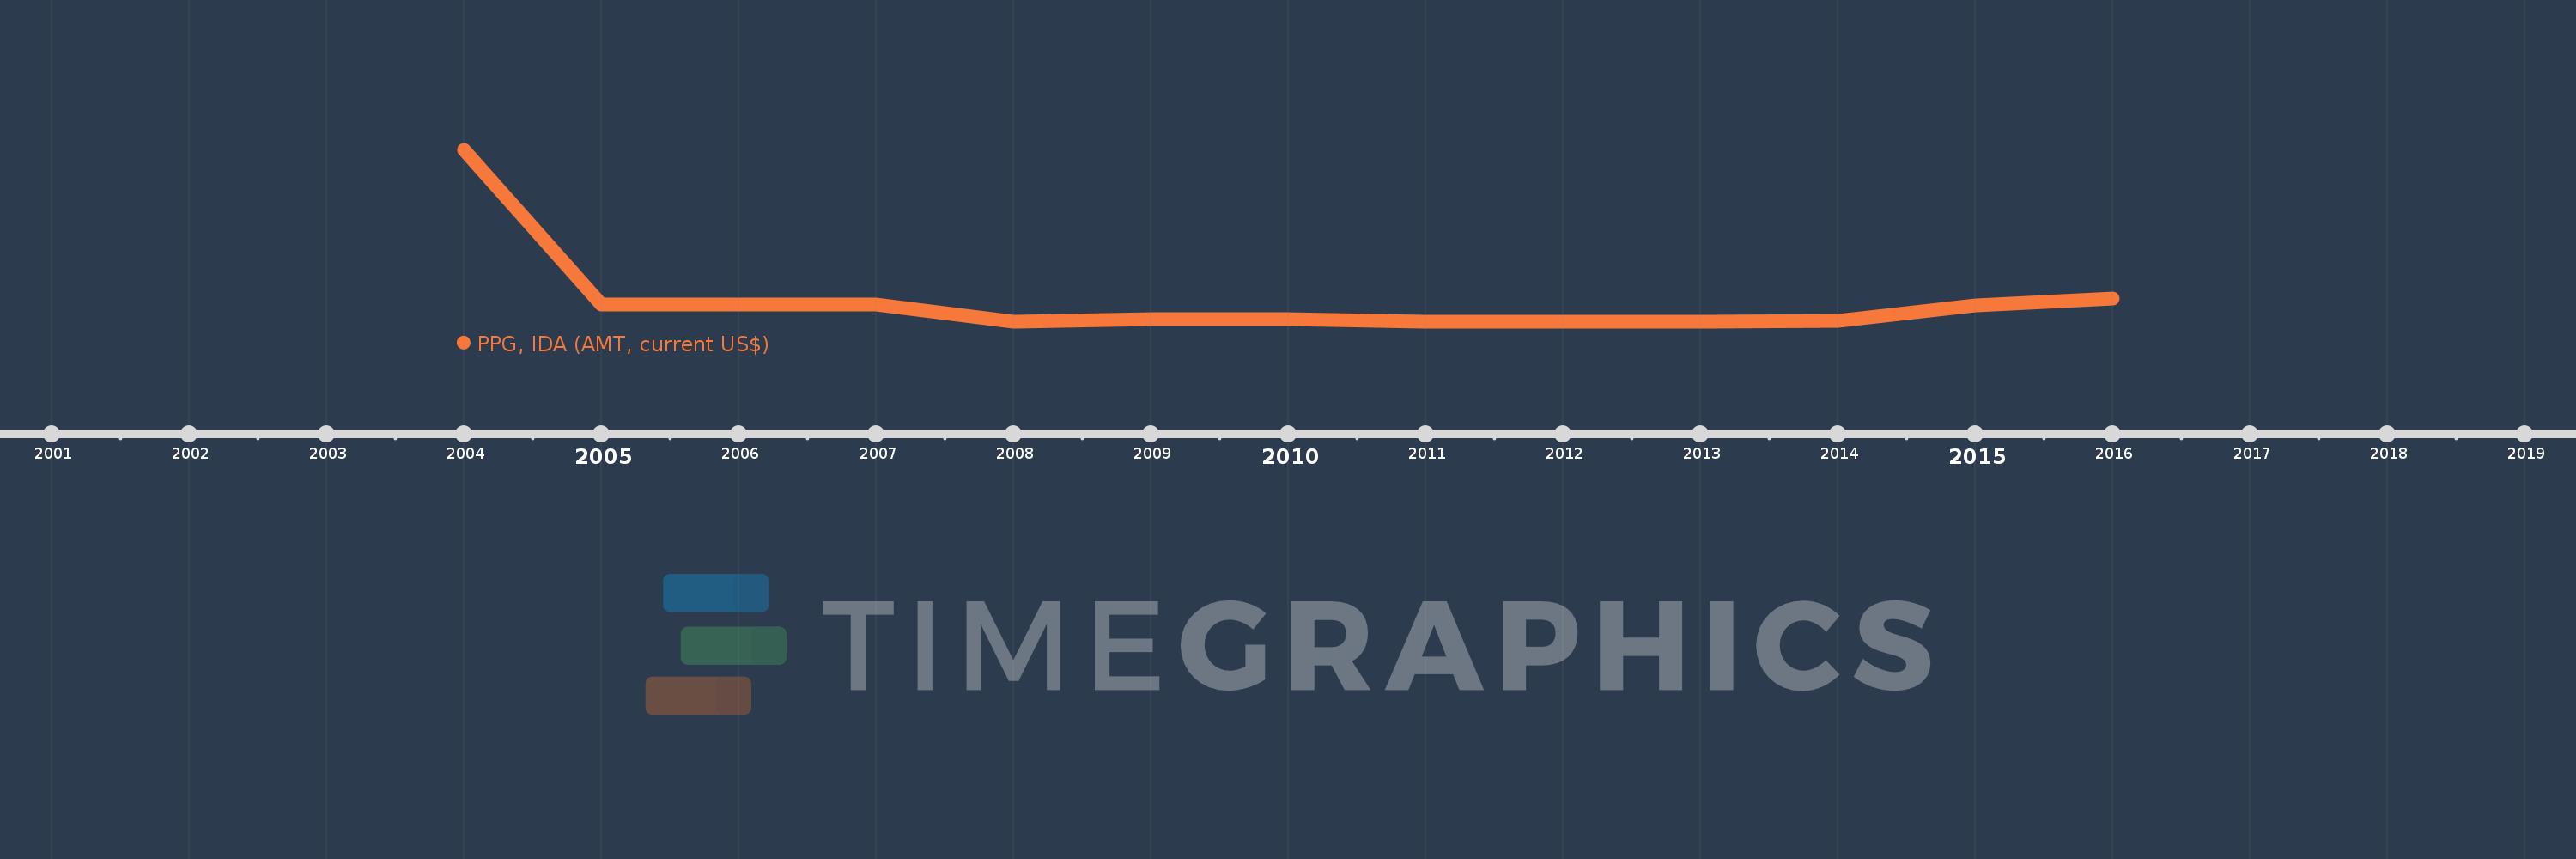
PPG, IDA (AMT, current US$)
2016,2015,2014,2013,2012,2011,2010,2009,2008,2007,2006,2005,2004
This statistics in other country:
Timeline:
This timeline shows a graph from 2004 to 2016 of Afghanistan. No data until 2003. Number of actual observations by date: 13.
Source name:
World Development Indicators
Source organization:
World Bank, International Debt Statistics.
Categories, topics:
External Debt
Last updated:
apr 23, 2017
Indicators value changes by year
Maximum:
25.112 mln
jan 1, 2004
At the date of observation
Value
Absolute change
Change from previous value
jan 1, 2004
25.112 mln
+25.112 mln
0.0%
jan 1, 2005
2.514 mln
-22.598 mln
-89.99%
jan 1, 2006
2.514 mln
0.0
0.0%
jan 1, 2007
2.514 mln
0.0
0.0%
jan 1, 2008
0.0
-2.514 mln
-100.0%
jan 1, 2009
415.0K
+415.0K
%
jan 1, 2010
431.0K
+16.0K
3.86%
jan 1, 2011
5.0K
-426.0K
-98.84%
jan 1, 2012
0.0
-5.0K
-100.0%
jan 1, 2014
154.0K
+154.0K
%
jan 1, 2015
2.431 mln
+2.277 mln
1.48K%
jan 1, 2016
3.455 mln
+1.024 mln
42.12%
Ranking of countries by current statistics by years


Comments: