29
/
en
AIzaSyAYiBZKx7MnpbEhh9jyipgxe19OcubqV5w
April 1, 2024
234039
Sao Tome and Principe
STP
true
2
1
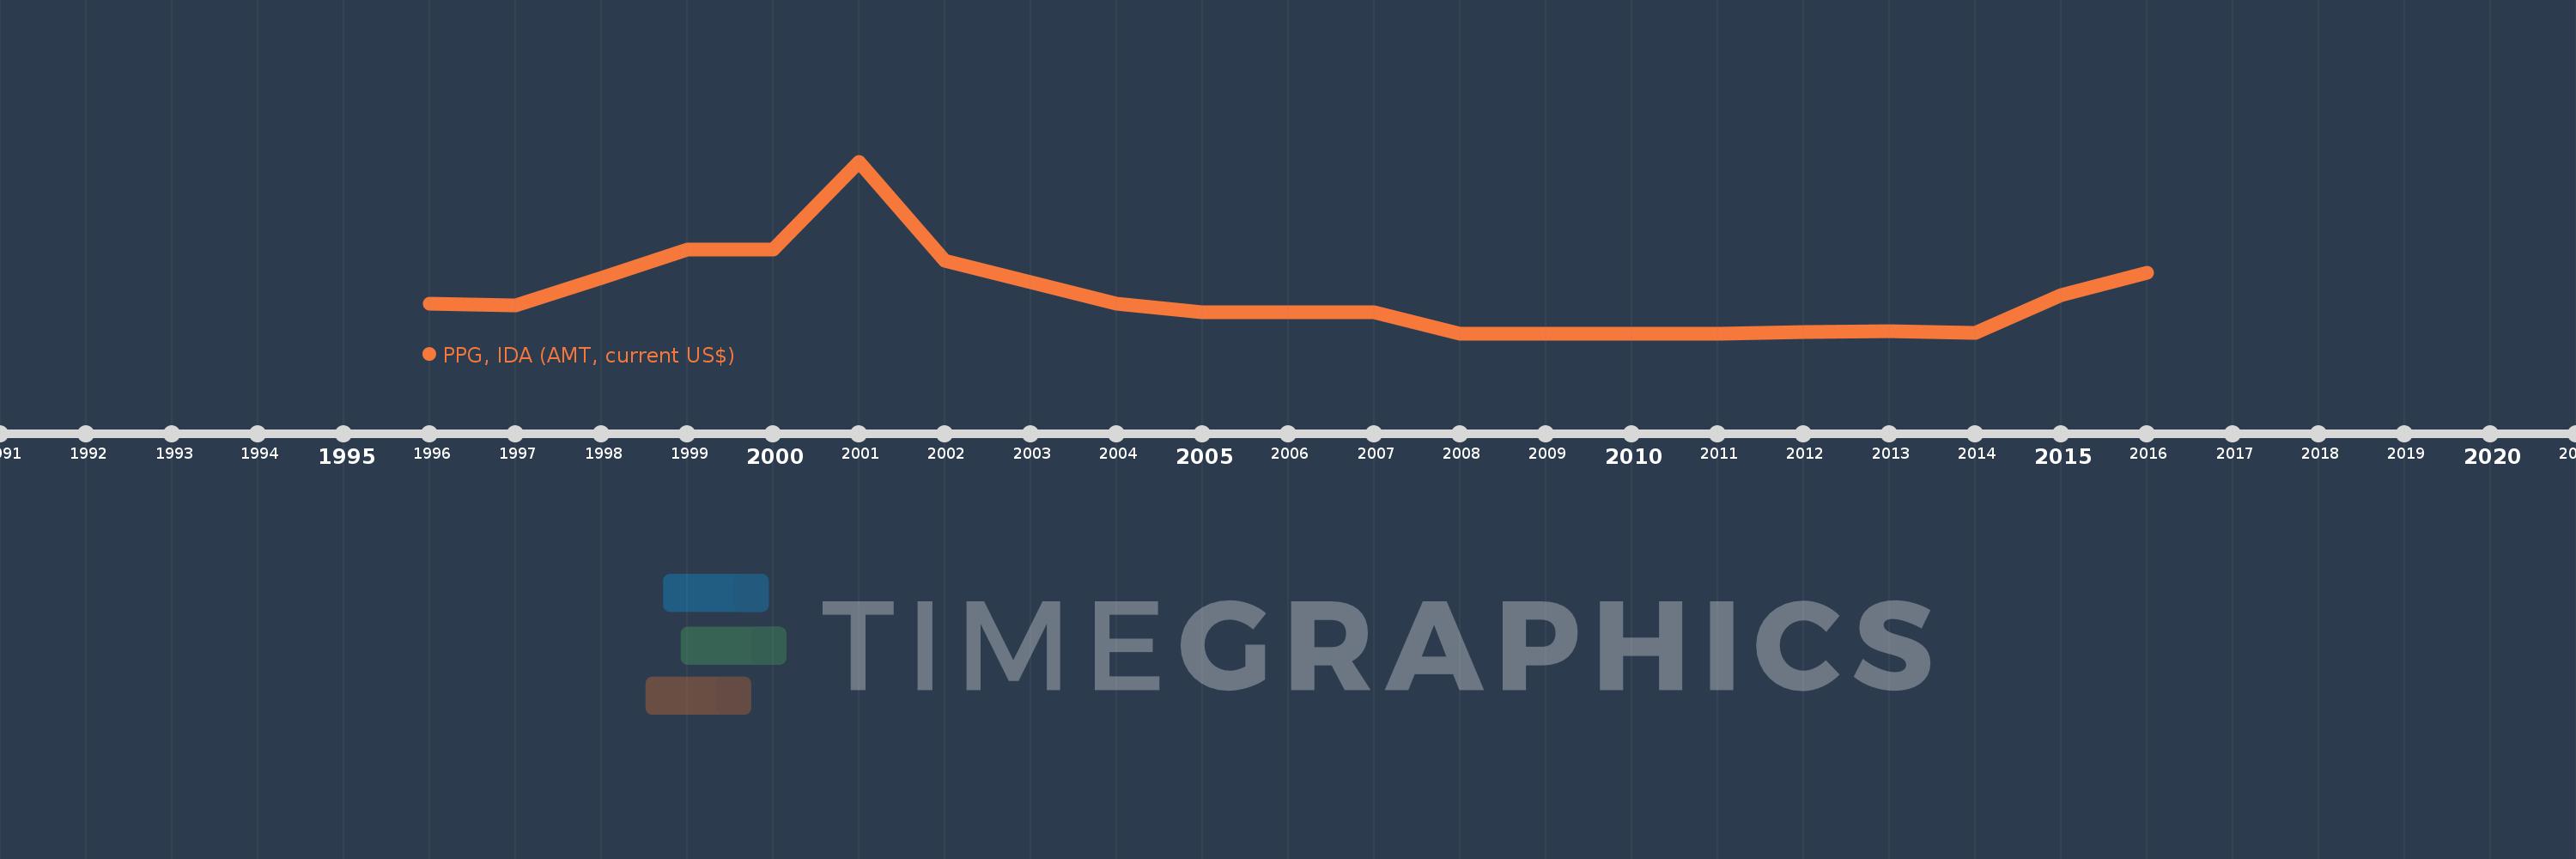
PPG, IDA (AMT, current US$)
2016,2015,2014,2013,2012,2011,2008,2007,2006,2005,2004,2002,2001,2000,1999,1998,1997,1996
This statistics in other country:
Timeline:
This timeline shows a graph from 1996 to 2016 of Sao Tome and Principe. No data until 1995. Number of actual observations by date: 18.
Source name:
World Development Indicators
Source organization:
World Bank, International Debt Statistics.
Categories, topics:
External Debt
Last updated:
apr 23, 2017
Indicators value changes by year
Maximum:
469.0K
jan 1, 2001
At the date of observation
Value
Absolute change
Change from previous value
jan 1, 1996
80.0K
+80.0K
0.0%
jan 1, 1997
76.0K
-4.0K
-5.0%
jan 1, 1998
151.0K
+75.0K
98.68%
jan 1, 1999
228.0K
+77.0K
50.99%
jan 1, 2000
228.0K
0.0
0.0%
jan 1, 2001
469.0K
+241.0K
105.7%
jan 1, 2002
198.0K
-271.0K
-57.78%
jan 1, 2004
80.0K
-118.0K
-59.6%
jan 1, 2005
57.0K
-23.0K
-28.75%
jan 1, 2006
58.0K
+1000.0
1.75%
jan 1, 2007
57.0K
-1000.0
-1.72%
jan 1, 2008
0.0
-57.0K
-100.0%
jan 1, 2013
7.0K
+4.0K
133.33%
jan 1, 2014
1000.0
-6.0K
-85.71%
jan 1, 2015
104.0K
+103.0K
10.3K%
jan 1, 2016
165.0K
+61.0K
58.65%
Ranking of countries by current statistics by years


Comments: