29
/
en
AIzaSyAYiBZKx7MnpbEhh9jyipgxe19OcubqV5w
April 1, 2024
252345
St. Vincent and the Grenadines
VCT
true
2
1
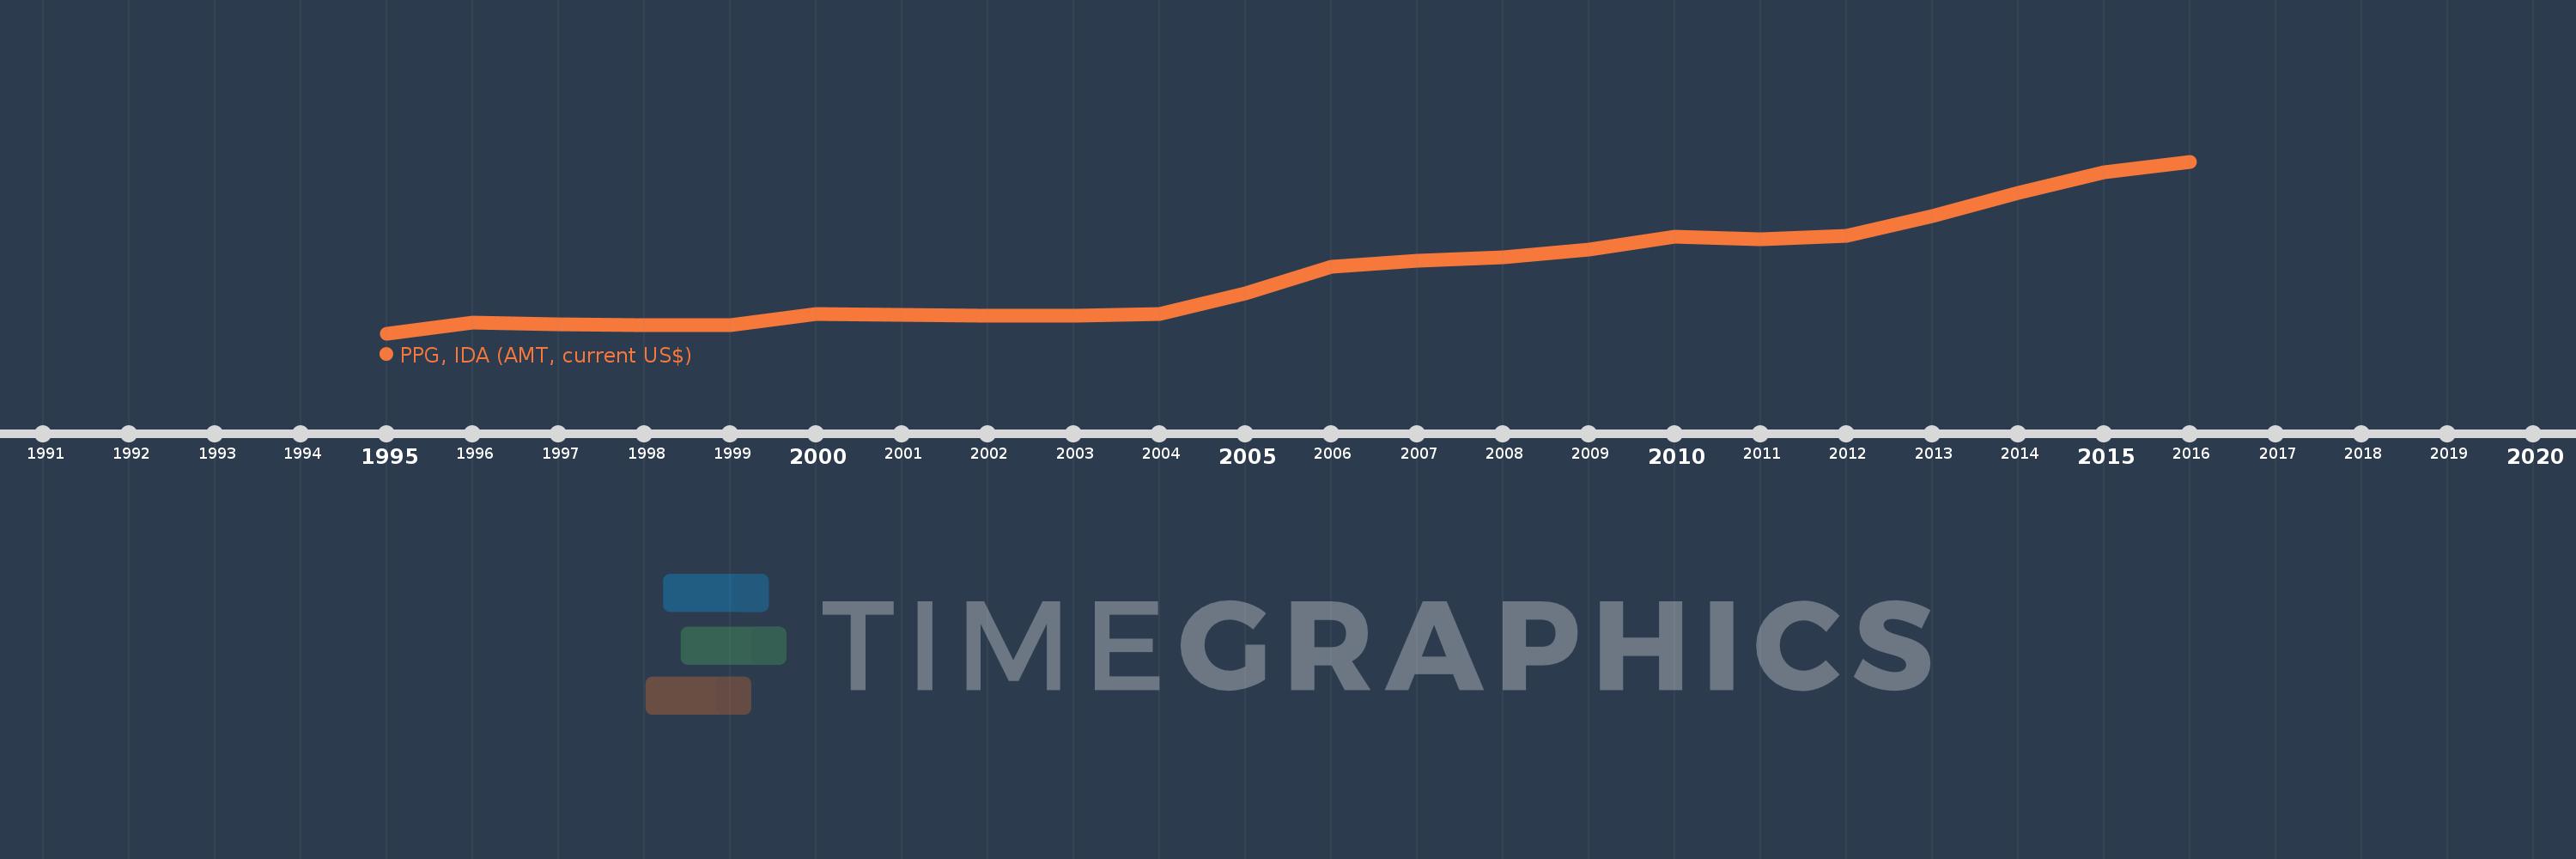
PPG, IDA (AMT, current US$)
2016,2015,2014,2013,2012,2011,2010,2009,2008,2007,2006,2005,2004,2003,2002,2001,2000,1999,1998,1997,1996,1995
This statistics in other country:
Timeline:
This timeline shows a graph from 1995 to 2016 of St. Vincent and the Grenadines. No data until 1994. Number of actual observations by date: 22.
Source name:
World Development Indicators
Source organization:
World Bank, International Debt Statistics.
Categories, topics:
External Debt
Last updated:
apr 23, 2017
Indicators value changes by year
Maximum:
620.0K
jan 1, 2016
At the date of observation
Value
Absolute change
Change from previous value
jan 1, 1995
32.0K
+32.0K
0.0%
jan 1, 1996
68.0K
+36.0K
112.5%
jan 1, 1997
64.0K
-4.0K
-5.88%
jan 1, 1998
61.0K
-3.0K
-4.69%
jan 1, 1999
60.0K
-1000.0
-1.64%
jan 1, 2000
98.0K
+38.0K
63.33%
jan 1, 2001
96.0K
-2.0K
-2.04%
jan 1, 2002
92.0K
-4.0K
-4.17%
jan 1, 2003
92.0K
0.0
0.0%
jan 1, 2004
99.0K
+7.0K
7.61%
jan 1, 2005
170.0K
+71.0K
71.72%
jan 1, 2006
261.0K
+91.0K
53.53%
jan 1, 2007
281.0K
+20.0K
7.66%
jan 1, 2008
293.0K
+12.0K
4.27%
jan 1, 2009
318.0K
+25.0K
8.53%
jan 1, 2010
362.0K
+44.0K
13.84%
jan 1, 2011
353.0K
-9.0K
-2.49%
jan 1, 2012
366.0K
+13.0K
3.68%
jan 1, 2013
433.0K
+67.0K
18.31%
jan 1, 2014
513.0K
+80.0K
18.48%
jan 1, 2015
583.0K
+70.0K
13.65%
jan 1, 2016
620.0K
+37.0K
6.35%
Ranking of countries by current statistics by years


Comments: