29
/
en
AIzaSyAYiBZKx7MnpbEhh9jyipgxe19OcubqV5w
April 1, 2024
91125
Brazil
BRA
true
2
1
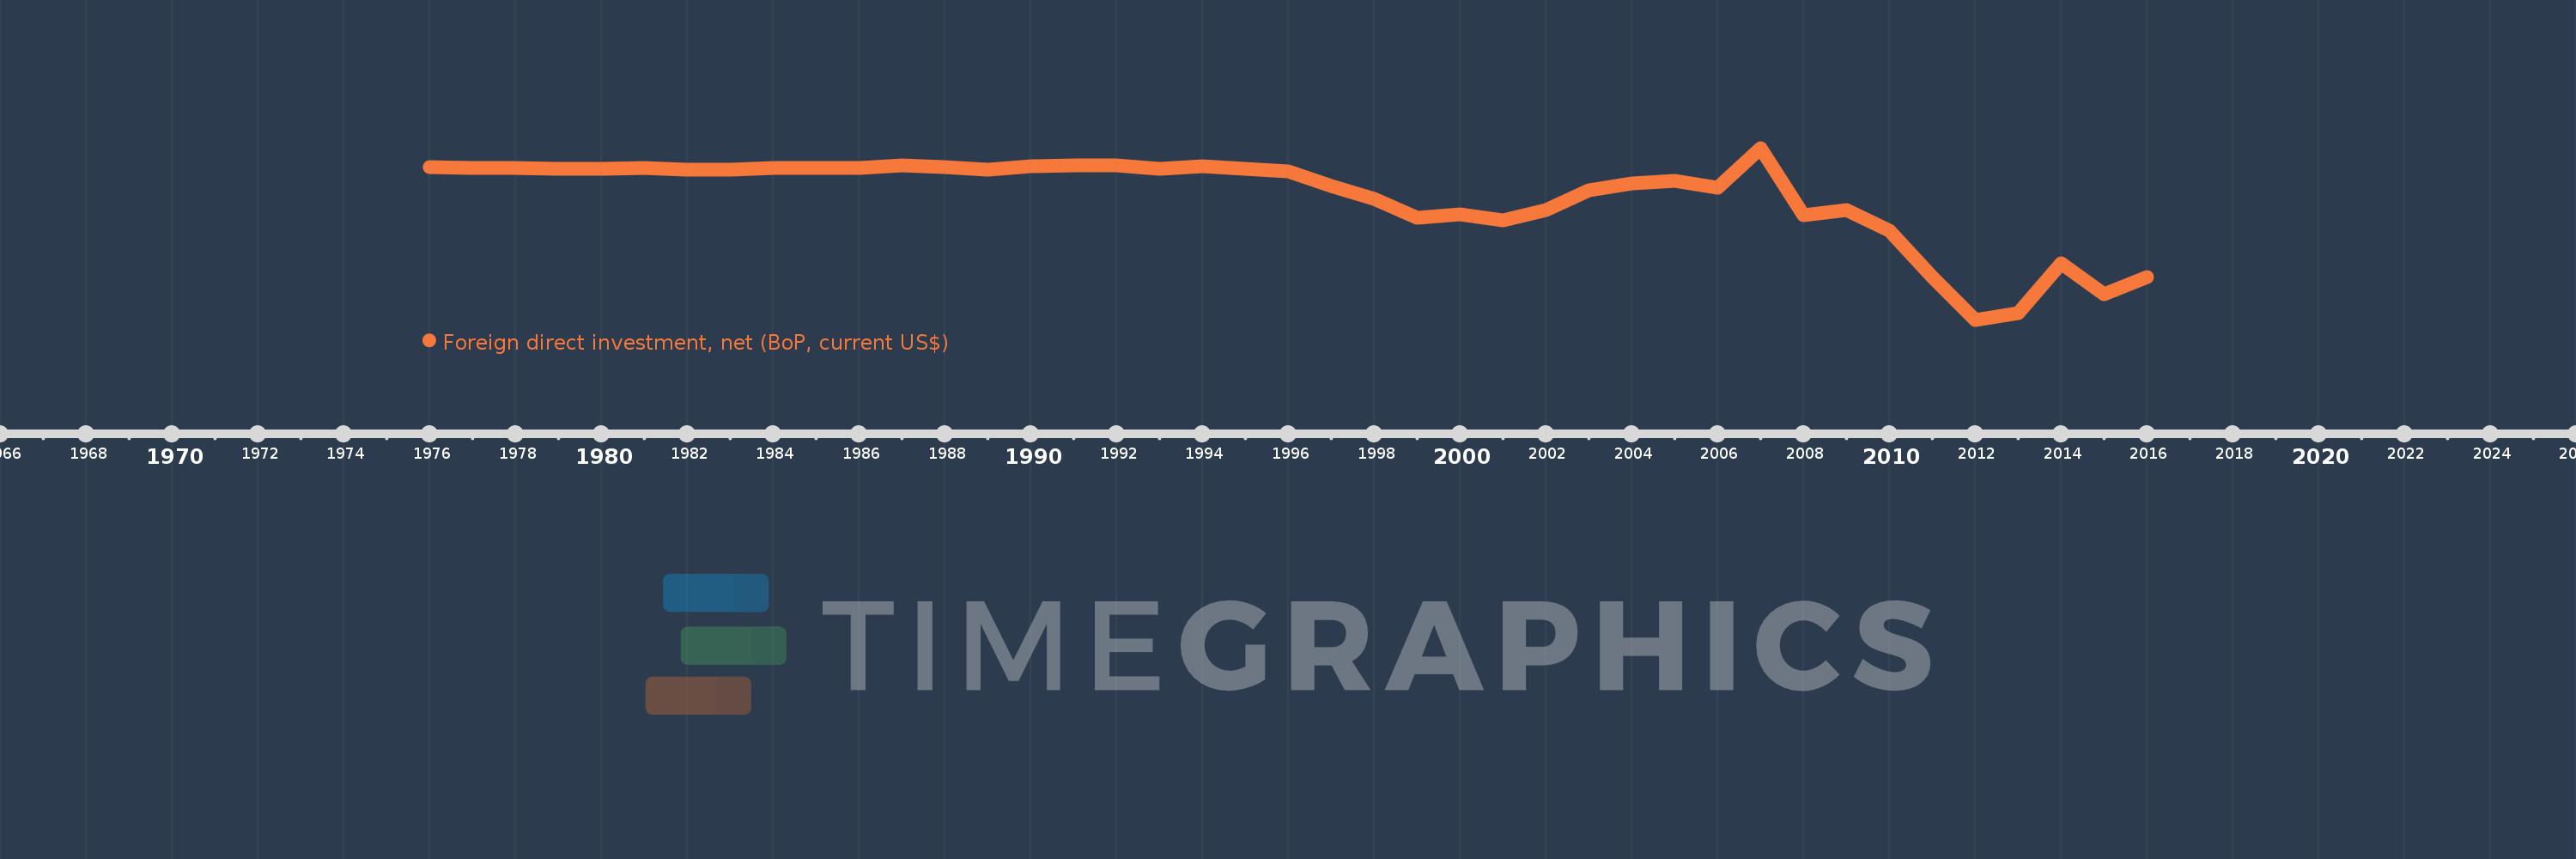
Foreign direct investment, net (BoP, current US$)
2016,2015,2014,2013,2012,2011,2010,2009,2008,2007,2006,2005,2004,2003,2002,2001,2000,1999,1998,1997,1996,1995,1994,1993,1992,1991,1990,1989,1988,1987,1986,1985,1984,1983,1982,1981,1980,1979,1978,1977,1976
This statistics in other country:
AfghanistanAlbaniaAlgeriaAngolaAntigua and BarbudaArgentinaArmeniaArubaAustraliaAustriaAzerbaijanBahamas, TheBahrainBangladeshBarbadosBelarusBelgiumBelizeBeninBermudaBhutanBoliviaBosnia and HerzegovinaBotswanaBrazilBrunei DarussalamBulgariaBurkina FasoBurundiCabo VerdeCambodiaCameroonCanadaCentral African RepublicChadChileChinaColombiaComorosCongo, Dem. Rep.Congo, Rep.Costa RicaCote d'IvoireCroatiaCuracaoCyprusCzech RepublicDenmarkDjiboutiDominicaDominican RepublicEcuadorEgypt, Arab Rep.El SalvadorEquatorial GuineaEritreaEstoniaEthiopiaEuro areaFijiFinlandFranceFrench PolynesiaGabonGambia, TheGeorgiaGermanyGhanaGreeceGrenadaGuatemalaGuineaGuinea-BissauGuyanaHaitiHondurasHong Kong SAR, ChinaHungaryIcelandIndiaIndonesiaIran, Islamic Rep.IraqIrelandIsraelItalyJamaicaJapanJordanKazakhstanKenyaKiribatiKorea, Rep.KosovoKuwaitKyrgyz RepublicLao PDRLatviaLebanonLesothoLiberiaLibyaLithuaniaLuxembourgMacao SAR, ChinaMacedonia, FYRMadagascarMalawiMalaysiaMaldivesMaliMaltaMarshall IslandsMauritaniaMauritiusMexicoMicronesia, Fed. Sts.MoldovaMongoliaMontenegroMoroccoMozambiqueMyanmarNamibiaNepalNetherlandsNew CaledoniaNew ZealandNicaraguaNigerNigeriaNorwayOmanPakistanPalauPanamaPapua New GuineaParaguayPeruPhilippinesPolandPortugalQatarRomaniaRussian FederationRwandaSamoaSao Tome and PrincipeSaudi ArabiaSenegalSerbiaSeychellesSierra LeoneSingaporeSint Maarten (Dutch part)Slovak RepublicSloveniaSolomon IslandsSouth AfricaSouth SudanSpainSri LankaSt. Kitts and NevisSt. LuciaSt. Vincent and the GrenadinesSudanSurinameSwazilandSwedenSwitzerlandSyrian Arab RepublicTajikistanTanzaniaThailandTimor-LesteTogoTongaTrinidad and TobagoTunisiaTurkeyTuvaluUgandaUkraineUnited KingdomUnited StatesUruguayVanuatuVenezuela, RBVietnamWest Bank and GazaYemen, Rep.ZambiaZimbabwe Timeline:
This timeline shows a graph from 1976 to 2016 of Brazil. No data until 1975. Number of actual observations by date: 41.
Source name:
World Development Indicators
Source organization:
International Monetary Fund, Balance of Payments Statistics Yearbook and data files.
Categories, topics:
Economy & Growth, Financial Sector
Last updated:
apr 23, 2017
Indicators value changes by year
Minimum:
-85.091 bln
jan 1, 2012
Maximum:
9.42 bln
jan 1, 2007
At the date of observation
Value
Absolute change
Change from previous value
jan 1, 1976
-1.19 bln
-1.19 bln
0.0%
jan 1, 1977
-1.372 bln
-182.0 mln
15.29%
jan 1, 1978
-1.687 bln
-315.0 mln
22.96%
jan 1, 1979
-1.882 bln
-195.0 mln
11.56%
jan 1, 1980
-2.223 bln
-341.0 mln
18.12%
jan 1, 1981
-1.544 bln
+679.0 mln
-30.54%
jan 1, 1982
-2.313 bln
-769.0 mln
49.81%
jan 1, 1983
-2.534 bln
-221.0 mln
9.55%
jan 1, 1984
-1.422 bln
+1.112 bln
-43.88%
jan 1, 1985
-1.552 bln
-130.0 mln
9.14%
jan 1, 1986
-1.36 bln
+192.0 mln
-12.37%
jan 1, 1987
-202.0 mln
+1.158 bln
-85.15%
jan 1, 1988
-1.031 bln
-829.0 mln
410.4%
jan 1, 1989
-2.629 bln
-1.598 bln
155.0%
jan 1, 1990
-608.0 mln
+2.021 bln
-76.87%
jan 1, 1991
-324.0 mln
+284.0 mln
-46.71%
jan 1, 1992
-89.0 mln
+235.0 mln
-72.53%
jan 1, 1993
-1.924 bln
-1.835 bln
2.06K%
jan 1, 1994
-801.0 mln
+1.123 bln
-58.37%
jan 1, 1995
-2.035 bln
-1.234 bln
154.06%
jan 1, 1996
-3.475 bln
-1.44 bln
70.76%
jan 1, 1997
-11.667 bln
-8.192 bln
235.74%
jan 1, 1998
-18.608 bln
-6.941 bln
59.49%
jan 1, 1999
-29.192 bln
-10.584 bln
56.88%
jan 1, 2000
-26.886 bln
+2.306 bln
-7.9%
jan 1, 2001
-30.498 bln
-3.612 bln
13.43%
jan 1, 2002
-24.715 bln
+5.783 bln
-18.96%
jan 1, 2003
-14.108 bln
+10.607 bln
-42.92%
jan 1, 2004
-9.894 bln
+4.214 bln
-29.87%
jan 1, 2005
-8.695 bln
+1.199 bln
-12.12%
jan 1, 2006
-12.55 bln
-3.855 bln
44.33%
jan 1, 2007
9.42 bln
+21.97 bln
-175.06%
jan 1, 2008
-27.518 bln
-36.939 bln
-392.12%
jan 1, 2009
-24.601 bln
+2.917 bln
-10.6%
jan 1, 2010
-36.033 bln
-11.432 bln
46.47%
jan 1, 2011
-61.689 bln
-25.656 bln
71.2%
jan 1, 2012
-85.091 bln
-23.402 bln
37.93%
jan 1, 2013
-81.399 bln
+3.692 bln
-4.34%
jan 1, 2014
-54.24 bln
+27.159 bln
-33.37%
jan 1, 2015
-70.855 bln
-16.616 bln
30.63%
jan 1, 2016
-61.576 bln
+9.279 bln
-13.1%
Ranking of countries by current statistics by years


Comments: