29
/
en
AIzaSyAYiBZKx7MnpbEhh9jyipgxe19OcubqV5w
April 1, 2024
245568
South Africa
ZAF
true
2
1
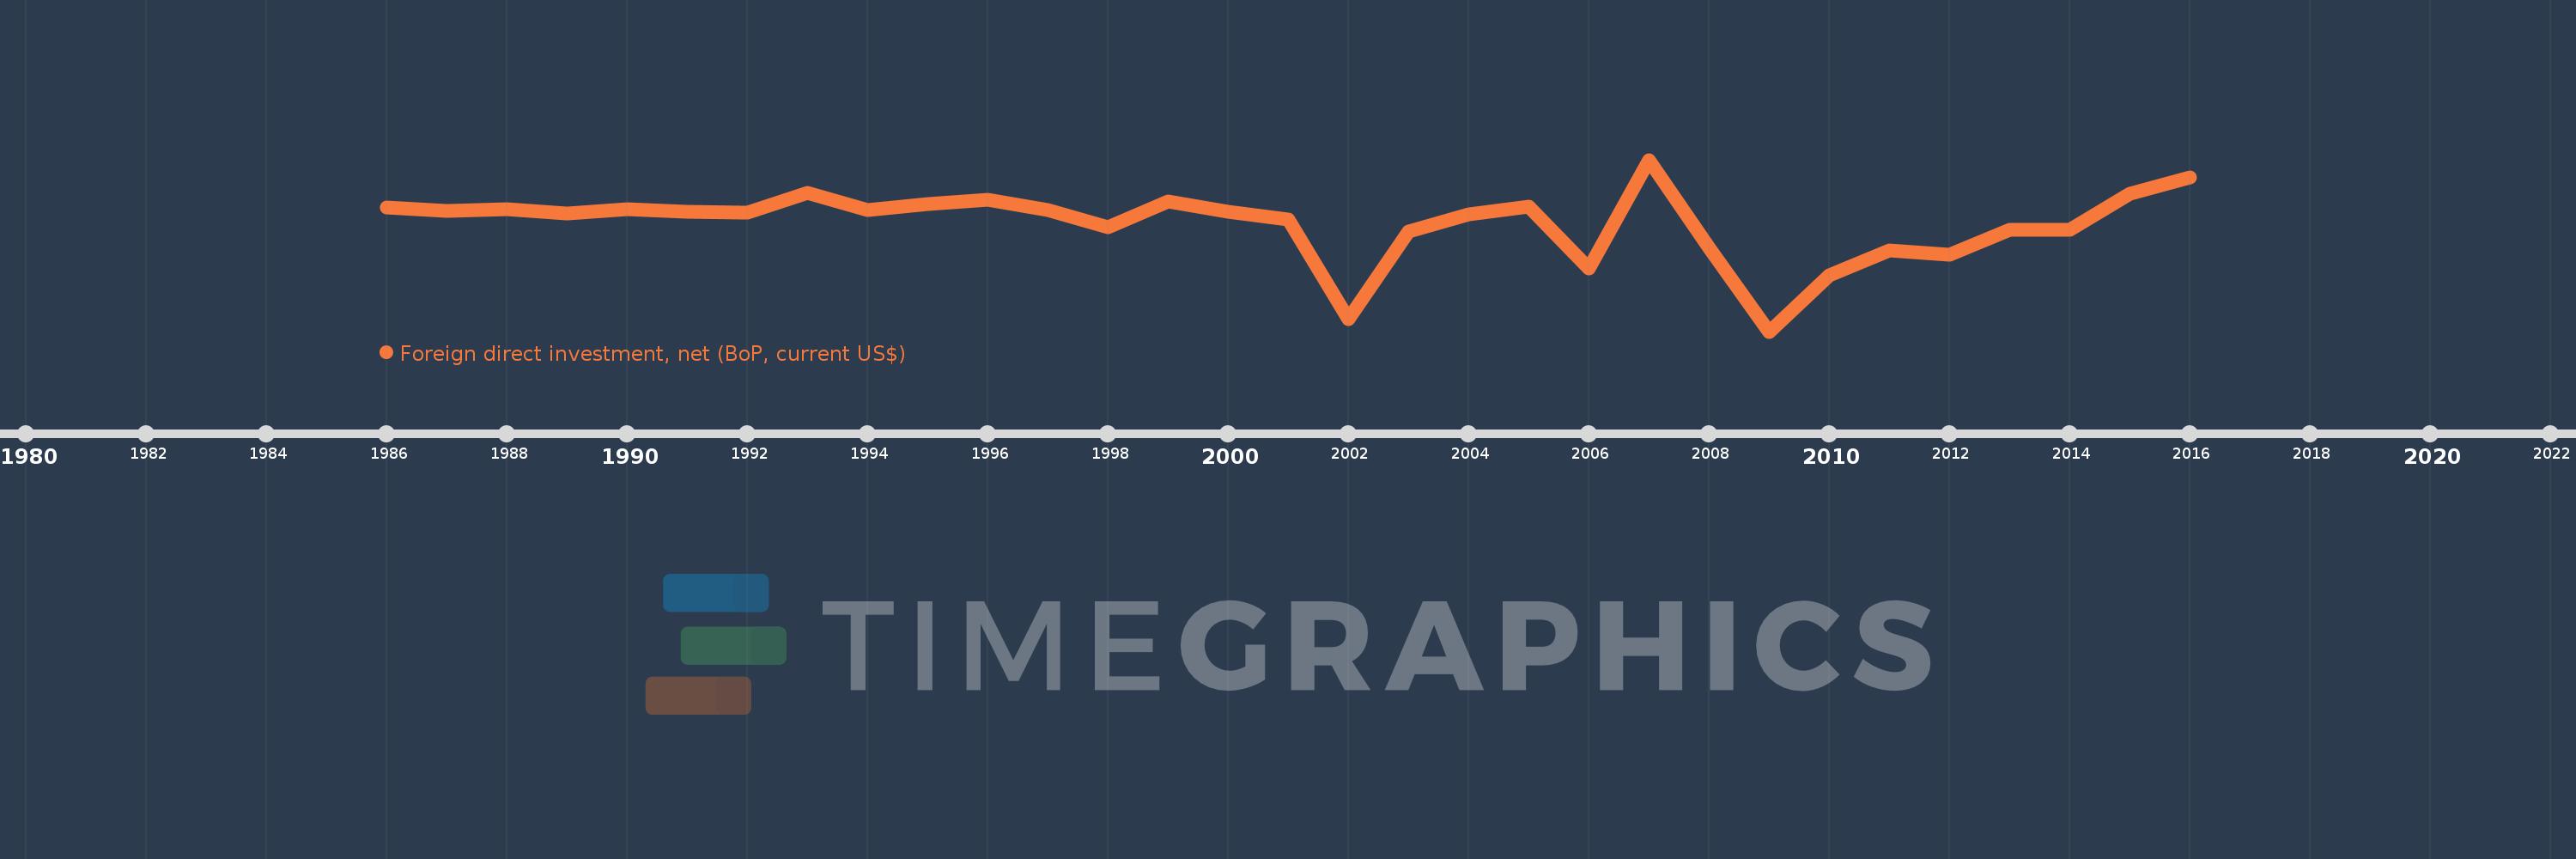
Foreign direct investment, net (BoP, current US$)
2016,2015,2014,2013,2012,2011,2010,2009,2008,2007,2006,2005,2004,2003,2002,2001,2000,1999,1998,1997,1996,1995,1994,1993,1992,1991,1990,1989,1988,1987,1986
This statistics in other country:
AfghanistanAlbaniaAlgeriaAngolaAntigua and BarbudaArgentinaArmeniaArubaAustraliaAustriaAzerbaijanBahamas, TheBahrainBangladeshBarbadosBelarusBelgiumBelizeBeninBermudaBhutanBoliviaBosnia and HerzegovinaBotswanaBrazilBrunei DarussalamBulgariaBurkina FasoBurundiCabo VerdeCambodiaCameroonCanadaCentral African RepublicChadChileChinaColombiaComorosCongo, Dem. Rep.Congo, Rep.Costa RicaCote d'IvoireCroatiaCuracaoCyprusCzech RepublicDenmarkDjiboutiDominicaDominican RepublicEcuadorEgypt, Arab Rep.El SalvadorEquatorial GuineaEritreaEstoniaEthiopiaEuro areaFijiFinlandFranceFrench PolynesiaGabonGambia, TheGeorgiaGermanyGhanaGreeceGrenadaGuatemalaGuineaGuinea-BissauGuyanaHaitiHondurasHong Kong SAR, ChinaHungaryIcelandIndiaIndonesiaIran, Islamic Rep.IraqIrelandIsraelItalyJamaicaJapanJordanKazakhstanKenyaKiribatiKorea, Rep.KosovoKuwaitKyrgyz RepublicLao PDRLatviaLebanonLesothoLiberiaLibyaLithuaniaLuxembourgMacao SAR, ChinaMacedonia, FYRMadagascarMalawiMalaysiaMaldivesMaliMaltaMarshall IslandsMauritaniaMauritiusMexicoMicronesia, Fed. Sts.MoldovaMongoliaMontenegroMoroccoMozambiqueMyanmarNamibiaNepalNetherlandsNew CaledoniaNew ZealandNicaraguaNigerNigeriaNorwayOmanPakistanPalauPanamaPapua New GuineaParaguayPeruPhilippinesPolandPortugalQatarRomaniaRussian FederationRwandaSamoaSao Tome and PrincipeSaudi ArabiaSenegalSerbiaSeychellesSierra LeoneSingaporeSint Maarten (Dutch part)Slovak RepublicSloveniaSolomon IslandsSouth AfricaSouth SudanSpainSri LankaSt. Kitts and NevisSt. LuciaSt. Vincent and the GrenadinesSudanSurinameSwazilandSwedenSwitzerlandSyrian Arab RepublicTajikistanTanzaniaThailandTimor-LesteTogoTongaTrinidad and TobagoTunisiaTurkeyTuvaluUgandaUkraineUnited KingdomUnited StatesUruguayVanuatuVenezuela, RBVietnamWest Bank and GazaYemen, Rep.ZambiaZimbabwe Timeline:
This timeline shows a graph from 1986 to 2016 of South Africa. No data until 1985. Number of actual observations by date: 31.
Source name:
World Development Indicators
Source organization:
International Monetary Fund, Balance of Payments Statistics Yearbook and data files.
Categories, topics:
Economy & Growth, Financial Sector
Last updated:
apr 23, 2017
Indicators value changes by year
Minimum:
-12.005 bln
jan 1, 2009
Maximum:
5.306 bln
jan 1, 2007
At the date of observation
Value
Absolute change
Change from previous value
jan 1, 1986
500.0 mln
+500.0 mln
0.0%
jan 1, 1987
121.467 mln
-378.533 mln
-75.71%
jan 1, 1988
303.793 mln
+182.325 mln
150.1%
jan 1, 1989
-93.871 mln
-397.664 mln
-130.9%
jan 1, 1990
363.908 mln
+457.779 mln
-487.67%
jan 1, 1991
103.697 mln
-260.211 mln
-71.5%
jan 1, 1992
-47.696 mln
-151.392 mln
-146.0%
jan 1, 1993
1.936 bln
+1.983 bln
-4.16K%
jan 1, 1994
280.624 mln
-1.655 bln
-85.5%
jan 1, 1995
886.096 mln
+605.472 mln
215.76%
jan 1, 1996
1.245 bln
+359.393 mln
40.56%
jan 1, 1997
231.585 mln
-1.014 bln
-81.41%
jan 1, 1998
-1.487 bln
-1.719 bln
-742.07%
jan 1, 1999
1.084 bln
+2.571 bln
-172.88%
jan 1, 2000
80.851 mln
-1.003 bln
-92.54%
jan 1, 2001
-691.653 mln
-772.503 mln
-955.47%
jan 1, 2002
-10.785 bln
-10.093 bln
1.46K%
jan 1, 2003
-1.882 bln
+8.903 bln
-82.55%
jan 1, 2004
-230.592 mln
+1.651 bln
-87.75%
jan 1, 2005
604.002 mln
+834.595 mln
-361.93%
jan 1, 2006
-5.613 bln
-6.217 bln
-1.03K%
jan 1, 2007
5.306 bln
+10.918 bln
-194.53%
jan 1, 2008
-3.605 bln
-8.91 bln
-167.94%
jan 1, 2009
-12.005 bln
-8.4 bln
233.03%
jan 1, 2010
-6.313 bln
+5.691 bln
-47.41%
jan 1, 2011
-3.855 bln
+2.459 bln
-38.94%
jan 1, 2012
-4.293 bln
-438.122 mln
11.37%
jan 1, 2013
-1.727 bln
+2.566 bln
-59.77%
jan 1, 2014
-1.713 bln
+14.514 mln
-0.84%
jan 1, 2015
1.9 bln
+3.613 bln
-210.96%
jan 1, 2016
3.552 bln
+1.651 bln
86.89%
Ranking of countries by current statistics by years


Comments: