29
/
en
AIzaSyAYiBZKx7MnpbEhh9jyipgxe19OcubqV5w
April 1, 2024
169889
Korea, Rep.
KOR
true
2
1
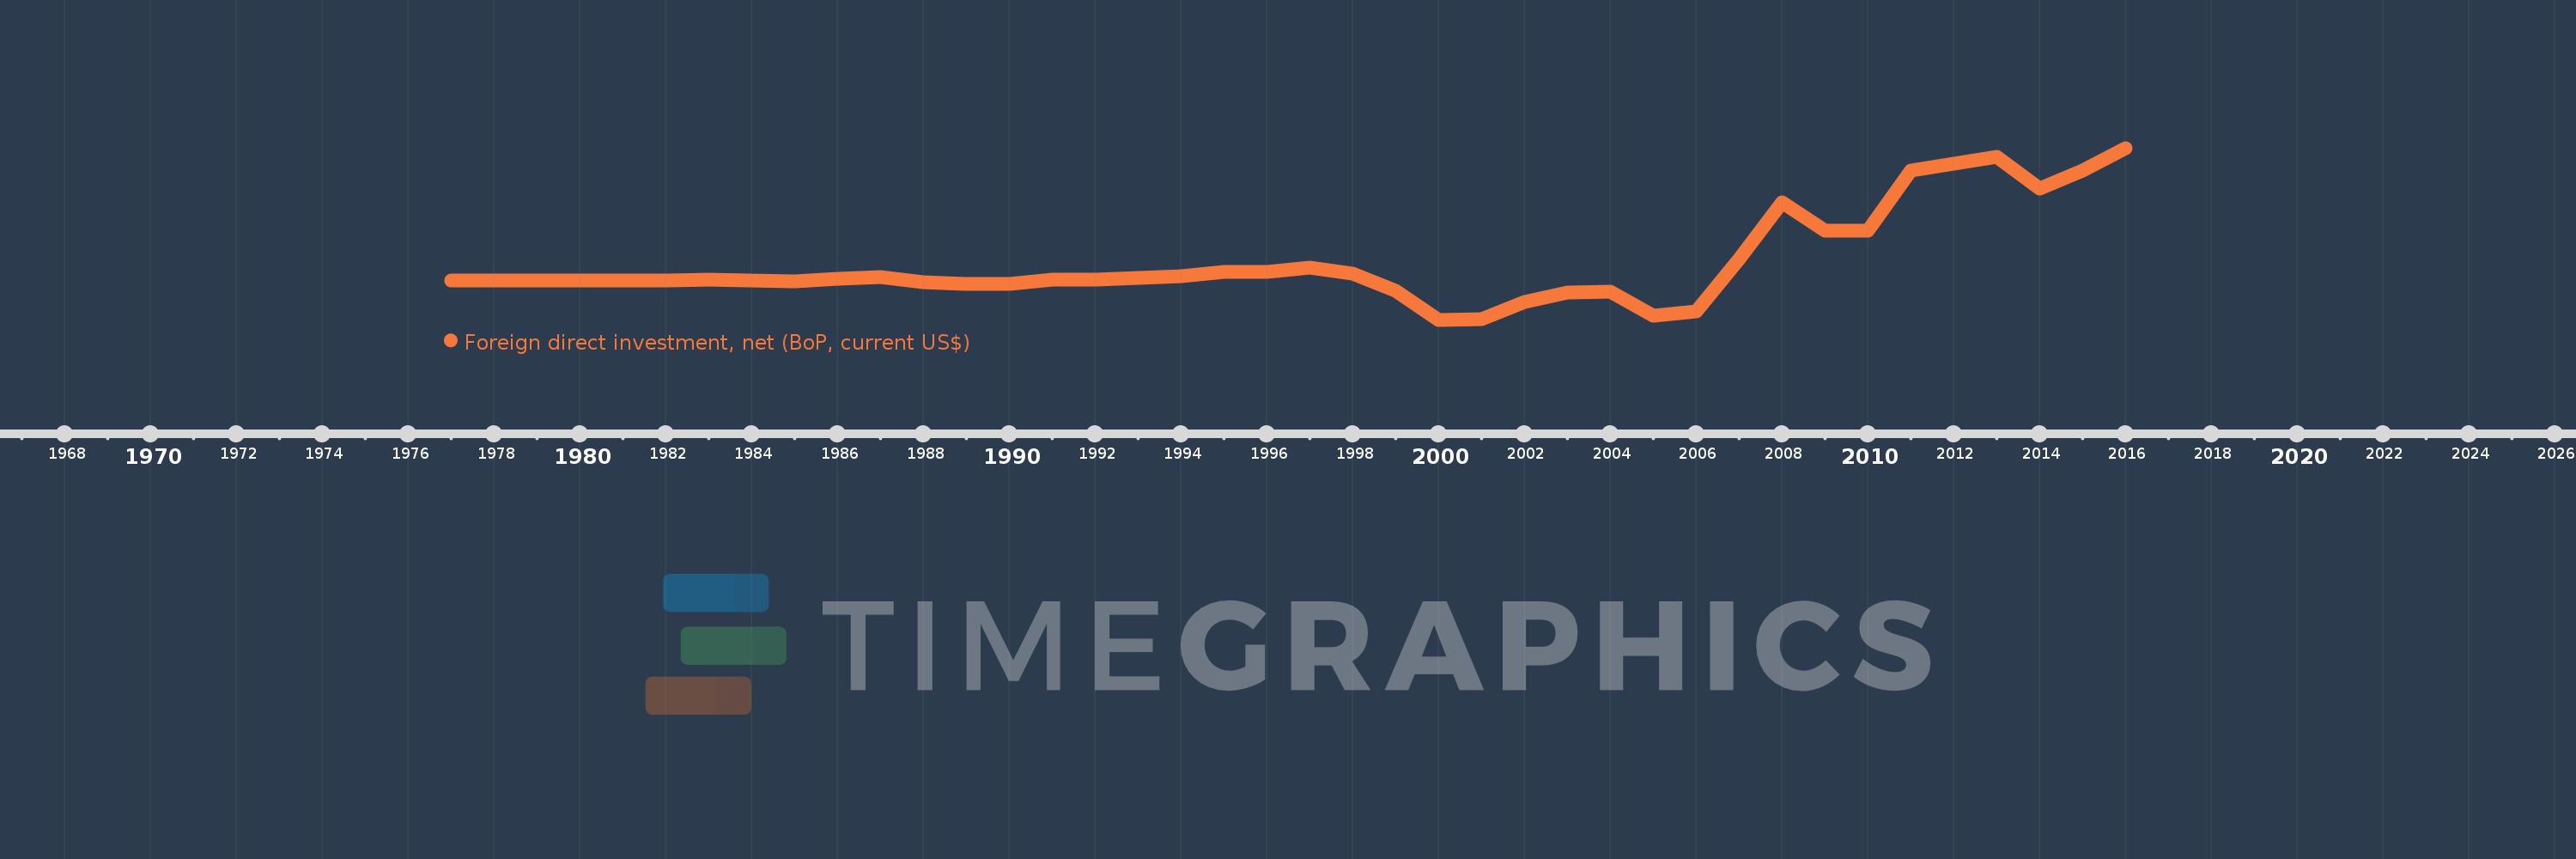
Foreign direct investment, net (BoP, current US$)
2016,2015,2014,2013,2012,2011,2010,2009,2008,2007,2006,2005,2004,2003,2002,2001,2000,1999,1998,1997,1996,1995,1994,1993,1992,1991,1990,1989,1988,1987,1986,1985,1984,1983,1982,1981,1979,1978,1977
This statistics in other country:
AfghanistanAlbaniaAlgeriaAngolaAntigua and BarbudaArgentinaArmeniaArubaAustraliaAustriaAzerbaijanBahamas, TheBahrainBangladeshBarbadosBelarusBelgiumBelizeBeninBermudaBhutanBoliviaBosnia and HerzegovinaBotswanaBrazilBrunei DarussalamBulgariaBurkina FasoBurundiCabo VerdeCambodiaCameroonCanadaCentral African RepublicChadChileChinaColombiaComorosCongo, Dem. Rep.Congo, Rep.Costa RicaCote d'IvoireCroatiaCuracaoCyprusCzech RepublicDenmarkDjiboutiDominicaDominican RepublicEcuadorEgypt, Arab Rep.El SalvadorEquatorial GuineaEritreaEstoniaEthiopiaEuro areaFijiFinlandFranceFrench PolynesiaGabonGambia, TheGeorgiaGermanyGhanaGreeceGrenadaGuatemalaGuineaGuinea-BissauGuyanaHaitiHondurasHong Kong SAR, ChinaHungaryIcelandIndiaIndonesiaIran, Islamic Rep.IraqIrelandIsraelItalyJamaicaJapanJordanKazakhstanKenyaKiribatiKorea, Rep.KosovoKuwaitKyrgyz RepublicLao PDRLatviaLebanonLesothoLiberiaLibyaLithuaniaLuxembourgMacao SAR, ChinaMacedonia, FYRMadagascarMalawiMalaysiaMaldivesMaliMaltaMarshall IslandsMauritaniaMauritiusMexicoMicronesia, Fed. Sts.MoldovaMongoliaMontenegroMoroccoMozambiqueMyanmarNamibiaNepalNetherlandsNew CaledoniaNew ZealandNicaraguaNigerNigeriaNorwayOmanPakistanPalauPanamaPapua New GuineaParaguayPeruPhilippinesPolandPortugalQatarRomaniaRussian FederationRwandaSamoaSao Tome and PrincipeSaudi ArabiaSenegalSerbiaSeychellesSierra LeoneSingaporeSint Maarten (Dutch part)Slovak RepublicSloveniaSolomon IslandsSouth AfricaSouth SudanSpainSri LankaSt. Kitts and NevisSt. LuciaSt. Vincent and the GrenadinesSudanSurinameSwazilandSwedenSwitzerlandSyrian Arab RepublicTajikistanTanzaniaThailandTimor-LesteTogoTongaTrinidad and TobagoTunisiaTurkeyTuvaluUgandaUkraineUnited KingdomUnited StatesUruguayVanuatuVenezuela, RBVietnamWest Bank and GazaYemen, Rep.ZambiaZimbabwe Timeline:
This timeline shows a graph from 1977 to 2016 of Korea, Rep.. No data until 1976. Number of actual observations by date: 39.
Source name:
World Development Indicators
Source organization:
International Monetary Fund, Balance of Payments Statistics Yearbook and data files.
Categories, topics:
Economy & Growth, Financial Sector
Last updated:
apr 23, 2017
Indicators value changes by year
Minimum:
-6.759 bln
jan 1, 2000
Maximum:
22.598 bln
jan 1, 2016
At the date of observation
Value
Absolute change
Change from previous value
jan 1, 1977
-75.0 mln
-75.0 mln
0.0%
jan 1, 1978
-73.0 mln
+2.0 mln
-2.67%
jan 1, 1979
-61.0 mln
+12.0 mln
-16.44%
jan 1, 1981
-4.2 mln
+56.8 mln
-93.11%
jan 1, 1982
-94.1 mln
-89.9 mln
2.14K%
jan 1, 1983
63.1 mln
+157.2 mln
-167.06%
jan 1, 1984
-15.4 mln
-78.5 mln
-124.41%
jan 1, 1985
-132.8 mln
-117.4 mln
762.34%
jan 1, 1986
252.5 mln
+385.3 mln
-290.14%
jan 1, 1987
586.6 mln
+334.1 mln
132.32%
jan 1, 1988
-294.3 mln
-880.9 mln
-150.17%
jan 1, 1989
-567.1 mln
-272.8 mln
92.69%
jan 1, 1990
-660.1 mln
-93.0 mln
16.4%
jan 1, 1991
87.6 mln
+747.7 mln
-113.27%
jan 1, 1992
136.0 mln
+48.4 mln
55.25%
jan 1, 1993
374.1 mln
+238.1 mln
175.07%
jan 1, 1994
611.2 mln
+237.1 mln
63.38%
jan 1, 1995
1.454 bln
+842.3 mln
137.81%
jan 1, 1996
1.381 bln
-72.1 mln
-4.96%
jan 1, 1997
2.171 bln
+789.3 mln
57.14%
jan 1, 1998
1.11 bln
-1.06 bln
-48.86%
jan 1, 1999
-1.769 bln
-2.879 bln
-259.33%
jan 1, 2000
-6.759 bln
-4.99 bln
282.11%
jan 1, 2001
-6.667 bln
+91.8 mln
-1.36%
jan 1, 2002
-3.779 bln
+2.889 bln
-43.32%
jan 1, 2003
-2.038 bln
+1.741 bln
-46.07%
jan 1, 2004
-1.991 bln
+46.7 mln
-2.29%
jan 1, 2005
-6.099 bln
-4.108 bln
206.29%
jan 1, 2006
-5.313 bln
+785.6 mln
-12.88%
jan 1, 2007
3.607 bln
+8.921 bln
-167.9%
jan 1, 2008
13.247 bln
+9.64 bln
267.23%
jan 1, 2009
8.445 bln
-4.802 bln
-36.25%
jan 1, 2010
8.414 bln
-31.1 mln
-0.37%
jan 1, 2011
18.782 bln
+10.368 bln
123.23%
jan 1, 2012
19.932 bln
+1.149 bln
6.12%
jan 1, 2013
21.136 bln
+1.204 bln
6.04%
jan 1, 2014
15.593 bln
-5.543 bln
-26.23%
jan 1, 2015
18.766 bln
+3.172 bln
20.34%
jan 1, 2016
22.598 bln
+3.832 bln
20.42%
Ranking of countries by current statistics by years


Comments: