29
/
en
AIzaSyAYiBZKx7MnpbEhh9jyipgxe19OcubqV5w
April 1, 2024
118890
Denmark
DNK
true
2
1
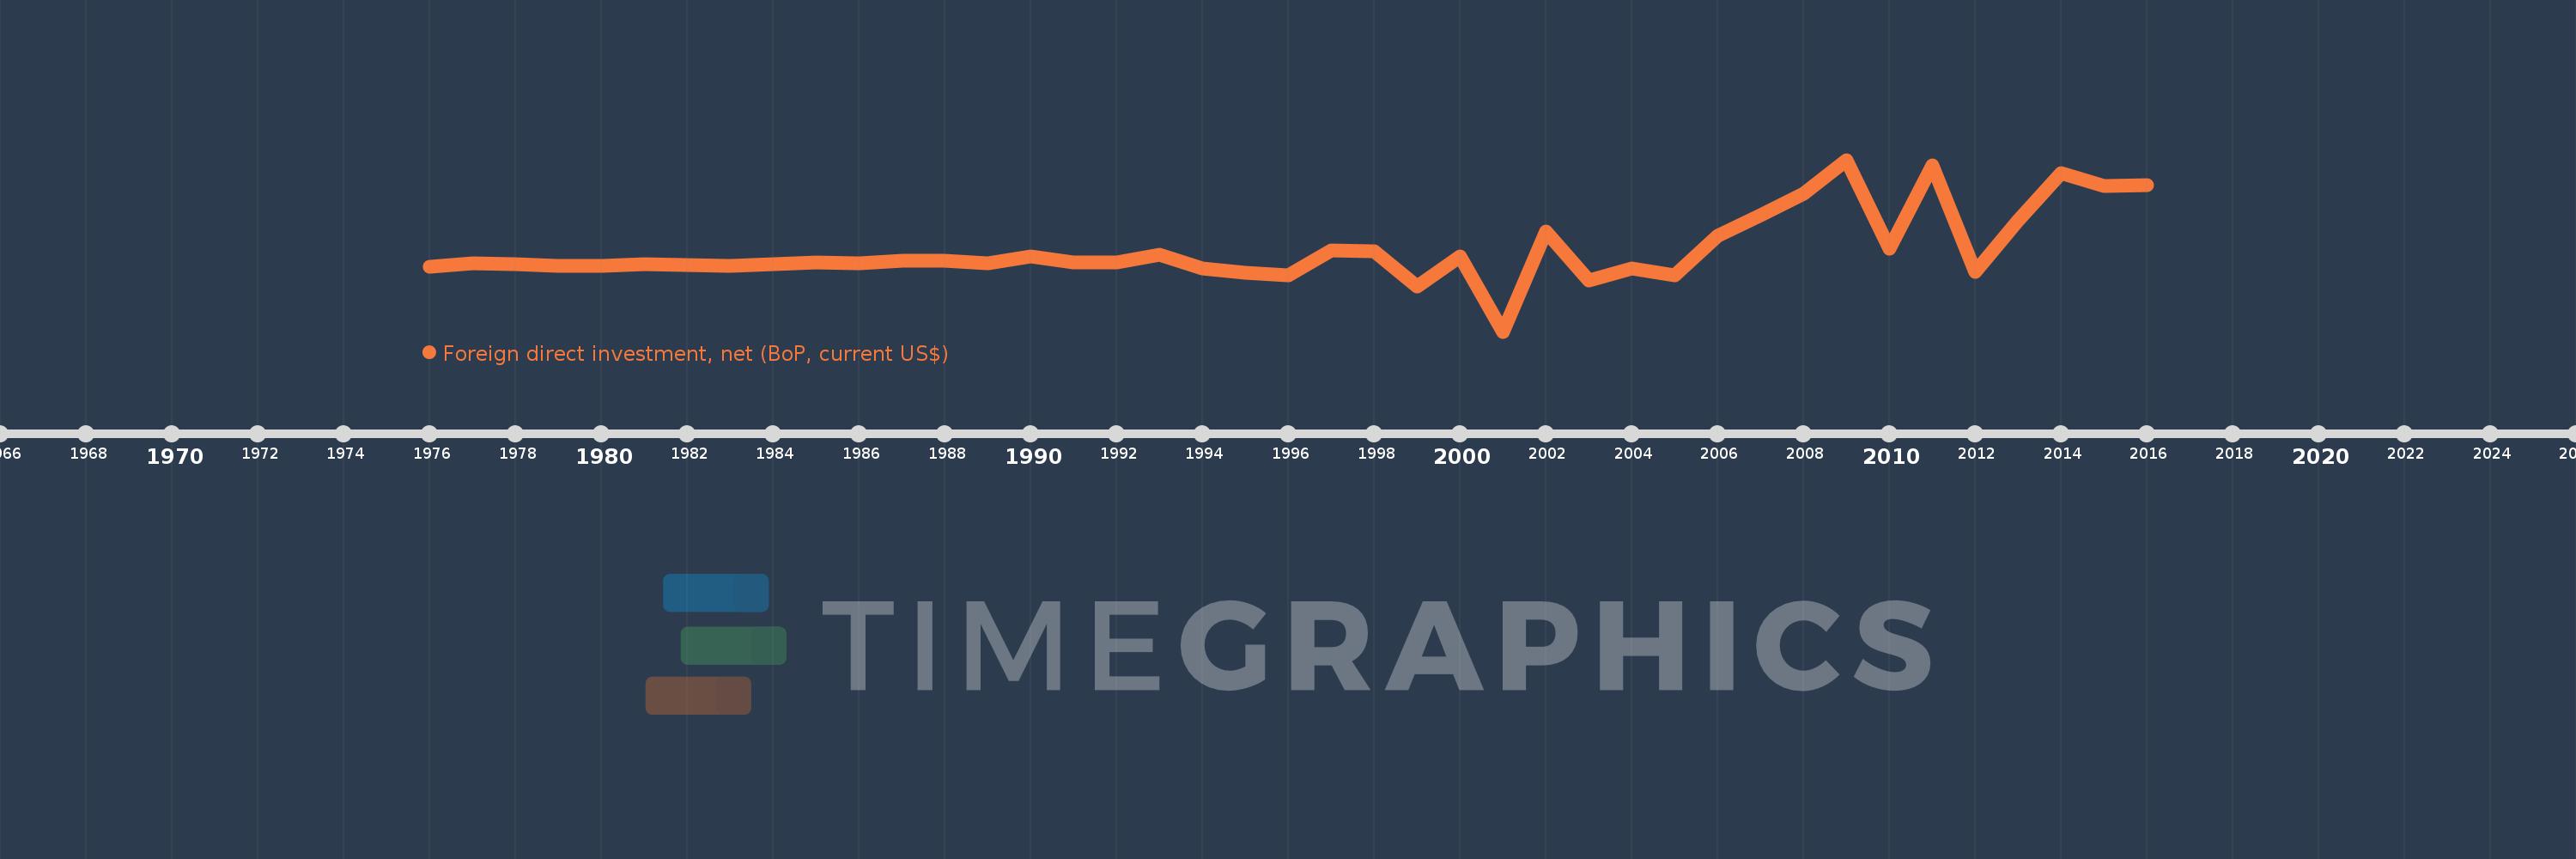
Foreign direct investment, net (BoP, current US$)
2016,2015,2014,2013,2012,2011,2010,2009,2008,2007,2006,2005,2004,2003,2002,2001,2000,1999,1998,1997,1996,1995,1994,1993,1992,1991,1990,1989,1988,1987,1986,1985,1984,1983,1982,1981,1980,1979,1978,1977,1976
This statistics in other country:
AfghanistanAlbaniaAlgeriaAngolaAntigua and BarbudaArgentinaArmeniaArubaAustraliaAustriaAzerbaijanBahamas, TheBahrainBangladeshBarbadosBelarusBelgiumBelizeBeninBermudaBhutanBoliviaBosnia and HerzegovinaBotswanaBrazilBrunei DarussalamBulgariaBurkina FasoBurundiCabo VerdeCambodiaCameroonCanadaCentral African RepublicChadChileChinaColombiaComorosCongo, Dem. Rep.Congo, Rep.Costa RicaCote d'IvoireCroatiaCuracaoCyprusCzech RepublicDenmarkDjiboutiDominicaDominican RepublicEcuadorEgypt, Arab Rep.El SalvadorEquatorial GuineaEritreaEstoniaEthiopiaEuro areaFijiFinlandFranceFrench PolynesiaGabonGambia, TheGeorgiaGermanyGhanaGreeceGrenadaGuatemalaGuineaGuinea-BissauGuyanaHaitiHondurasHong Kong SAR, ChinaHungaryIcelandIndiaIndonesiaIran, Islamic Rep.IraqIrelandIsraelItalyJamaicaJapanJordanKazakhstanKenyaKiribatiKorea, Rep.KosovoKuwaitKyrgyz RepublicLao PDRLatviaLebanonLesothoLiberiaLibyaLithuaniaLuxembourgMacao SAR, ChinaMacedonia, FYRMadagascarMalawiMalaysiaMaldivesMaliMaltaMarshall IslandsMauritaniaMauritiusMexicoMicronesia, Fed. Sts.MoldovaMongoliaMontenegroMoroccoMozambiqueMyanmarNamibiaNepalNetherlandsNew CaledoniaNew ZealandNicaraguaNigerNigeriaNorwayOmanPakistanPalauPanamaPapua New GuineaParaguayPeruPhilippinesPolandPortugalQatarRomaniaRussian FederationRwandaSamoaSao Tome and PrincipeSaudi ArabiaSenegalSerbiaSeychellesSierra LeoneSingaporeSint Maarten (Dutch part)Slovak RepublicSloveniaSolomon IslandsSouth AfricaSouth SudanSpainSri LankaSt. Kitts and NevisSt. LuciaSt. Vincent and the GrenadinesSudanSurinameSwazilandSwedenSwitzerlandSyrian Arab RepublicTajikistanTanzaniaThailandTimor-LesteTogoTongaTrinidad and TobagoTunisiaTurkeyTuvaluUgandaUkraineUnited KingdomUnited StatesUruguayVanuatuVenezuela, RBVietnamWest Bank and GazaYemen, Rep.ZambiaZimbabwe Timeline:
This timeline shows a graph from 1976 to 2016 of Denmark. No data until 1975. Number of actual observations by date: 41.
Source name:
World Development Indicators
Source organization:
International Monetary Fund, Balance of Payments Statistics Yearbook and data files.
Categories, topics:
Economy & Growth, Financial Sector
Last updated:
apr 23, 2017
Indicators value changes by year
Minimum:
-7.632 bln
jan 1, 2001
Maximum:
12.133 bln
jan 1, 2009
At the date of observation
Value
Absolute change
Change from previous value
jan 1, 1976
-188.13 mln
-188.13 mln
0.0%
jan 1, 1977
253.837 mln
+441.967 mln
-234.93%
jan 1, 1978
85.469 mln
-168.368 mln
-66.33%
jan 1, 1979
-56.245 mln
-141.713 mln
-165.81%
jan 1, 1980
-56.53 mln
-285.714K
0.51%
jan 1, 1981
91.531 mln
+148.062 mln
-261.92%
jan 1, 1982
39.338 mln
-52.194 mln
-57.02%
jan 1, 1983
-52.129 mln
-91.467 mln
-232.52%
jan 1, 1984
89.99 mln
+142.119 mln
-272.63%
jan 1, 1985
304.221 mln
+214.231 mln
238.06%
jan 1, 1986
195.333 mln
-108.888 mln
-35.79%
jan 1, 1987
491.188 mln
+295.855 mln
151.46%
jan 1, 1988
533.959 mln
+42.771 mln
8.71%
jan 1, 1989
217.149 mln
-316.81 mln
-59.33%
jan 1, 1990
976.235 mln
+759.086 mln
349.57%
jan 1, 1991
350.088 mln
-626.147 mln
-64.14%
jan 1, 1992
299.473 mln
-50.615 mln
-14.46%
jan 1, 1993
1.219 bln
+919.194 mln
306.94%
jan 1, 1994
-339.77 mln
-1.558 bln
-127.88%
jan 1, 1995
-844.398 mln
-504.627 mln
148.52%
jan 1, 1996
-1.171 bln
-326.356 mln
38.65%
jan 1, 1997
1.737 bln
+2.908 bln
-248.37%
jan 1, 1998
1.563 bln
-173.889 mln
-10.01%
jan 1, 1999
-2.46 bln
-4.023 bln
-257.38%
jan 1, 2000
971.169 mln
+3.431 bln
-139.48%
jan 1, 2001
-7.632 bln
-8.603 bln
-885.87%
jan 1, 2002
3.867 bln
+11.499 bln
-150.67%
jan 1, 2003
-1.781 bln
-5.648 bln
-146.06%
jan 1, 2004
-328.532 mln
+1.453 bln
-81.55%
jan 1, 2005
-1.126 bln
-797.233 mln
242.67%
jan 1, 2006
3.372 bln
+4.498 bln
-399.55%
jan 1, 2007
5.726 bln
+2.354 bln
69.81%
jan 1, 2008
8.186 bln
+2.46 bln
42.95%
jan 1, 2009
12.133 bln
+3.947 bln
48.22%
jan 1, 2010
1.943 bln
-10.19 bln
-83.99%
jan 1, 2011
11.5 bln
+9.558 bln
491.96%
jan 1, 2012
-760.896 mln
-12.261 bln
-106.62%
jan 1, 2013
5.21 bln
+5.971 bln
-784.75%
jan 1, 2014
10.625 bln
+5.415 bln
103.93%
jan 1, 2015
9.079 bln
-1.546 bln
-14.55%
jan 1, 2016
9.222 bln
+142.903 mln
1.57%
Ranking of countries by current statistics by years


Comments: