29
/
en
AIzaSyAYiBZKx7MnpbEhh9jyipgxe19OcubqV5w
April 1, 2024
133124
Finland
FIN
true
2
1
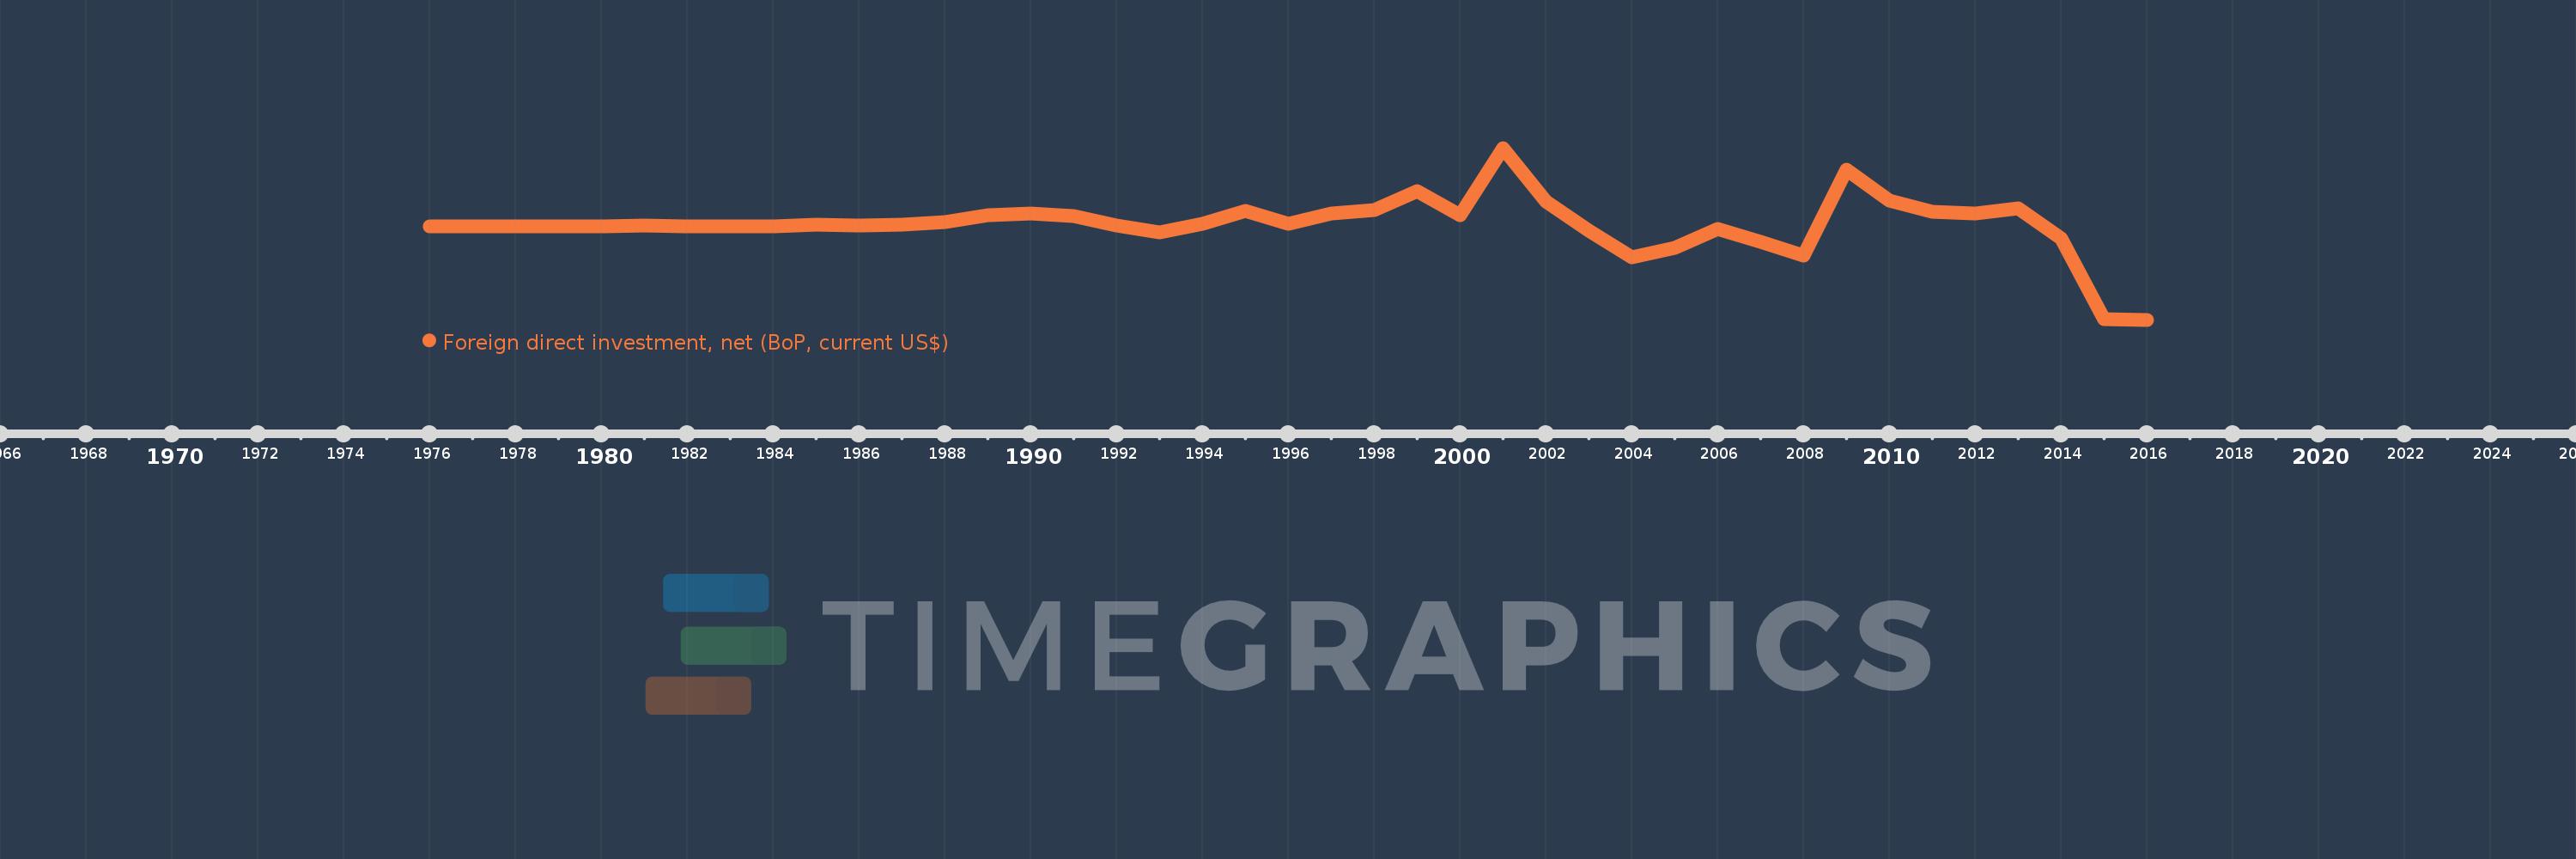
Foreign direct investment, net (BoP, current US$)
2016,2015,2014,2013,2012,2011,2010,2009,2008,2007,2006,2005,2004,2003,2002,2001,2000,1999,1998,1997,1996,1995,1994,1993,1992,1991,1990,1989,1988,1987,1986,1985,1984,1983,1982,1981,1980,1979,1978,1977,1976
This statistics in other country:
AfghanistanAlbaniaAlgeriaAngolaAntigua and BarbudaArgentinaArmeniaArubaAustraliaAustriaAzerbaijanBahamas, TheBahrainBangladeshBarbadosBelarusBelgiumBelizeBeninBermudaBhutanBoliviaBosnia and HerzegovinaBotswanaBrazilBrunei DarussalamBulgariaBurkina FasoBurundiCabo VerdeCambodiaCameroonCanadaCentral African RepublicChadChileChinaColombiaComorosCongo, Dem. Rep.Congo, Rep.Costa RicaCote d'IvoireCroatiaCuracaoCyprusCzech RepublicDenmarkDjiboutiDominicaDominican RepublicEcuadorEgypt, Arab Rep.El SalvadorEquatorial GuineaEritreaEstoniaEthiopiaEuro areaFijiFinlandFranceFrench PolynesiaGabonGambia, TheGeorgiaGermanyGhanaGreeceGrenadaGuatemalaGuineaGuinea-BissauGuyanaHaitiHondurasHong Kong SAR, ChinaHungaryIcelandIndiaIndonesiaIran, Islamic Rep.IraqIrelandIsraelItalyJamaicaJapanJordanKazakhstanKenyaKiribatiKorea, Rep.KosovoKuwaitKyrgyz RepublicLao PDRLatviaLebanonLesothoLiberiaLibyaLithuaniaLuxembourgMacao SAR, ChinaMacedonia, FYRMadagascarMalawiMalaysiaMaldivesMaliMaltaMarshall IslandsMauritaniaMauritiusMexicoMicronesia, Fed. Sts.MoldovaMongoliaMontenegroMoroccoMozambiqueMyanmarNamibiaNepalNetherlandsNew CaledoniaNew ZealandNicaraguaNigerNigeriaNorwayOmanPakistanPalauPanamaPapua New GuineaParaguayPeruPhilippinesPolandPortugalQatarRomaniaRussian FederationRwandaSamoaSao Tome and PrincipeSaudi ArabiaSenegalSerbiaSeychellesSierra LeoneSingaporeSint Maarten (Dutch part)Slovak RepublicSloveniaSolomon IslandsSouth AfricaSouth SudanSpainSri LankaSt. Kitts and NevisSt. LuciaSt. Vincent and the GrenadinesSudanSurinameSwazilandSwedenSwitzerlandSyrian Arab RepublicTajikistanTanzaniaThailandTimor-LesteTogoTongaTrinidad and TobagoTunisiaTurkeyTuvaluUgandaUkraineUnited KingdomUnited StatesUruguayVanuatuVenezuela, RBVietnamWest Bank and GazaYemen, Rep.ZambiaZimbabwe Timeline:
This timeline shows a graph from 1976 to 2016 of Finland. No data until 1975. Number of actual observations by date: 41.
Source name:
World Development Indicators
Source organization:
International Monetary Fund, Balance of Payments Statistics Yearbook and data files.
Categories, topics:
Economy & Growth, Financial Sector
Last updated:
apr 23, 2017
Indicators value changes by year
Minimum:
-17.532 bln
jan 1, 2016
Maximum:
14.773 bln
jan 1, 2001
At the date of observation
Value
Absolute change
Change from previous value
jan 1, 1976
-42.293 mln
-42.293 mln
0.0%
jan 1, 1977
-27.464 mln
+14.829 mln
-35.06%
jan 1, 1978
24.131 mln
+51.595 mln
-187.87%
jan 1, 1979
28.729 mln
+4.597 mln
19.05%
jan 1, 1980
97.495 mln
+68.767 mln
239.37%
jan 1, 1981
108.818 mln
+11.323 mln
11.61%
jan 1, 1982
29.256 mln
-79.563 mln
-73.12%
jan 1, 1983
77.245 mln
+47.989 mln
164.03%
jan 1, 1984
54.097 mln
-23.148 mln
-29.97%
jan 1, 1985
355.985 mln
+301.888 mln
558.05%
jan 1, 1986
235.398 mln
-120.587 mln
-33.87%
jan 1, 1987
412.669 mln
+177.271 mln
75.31%
jan 1, 1988
876.359 mln
+463.689 mln
112.36%
jan 1, 1989
2.092 bln
+1.216 bln
138.75%
jan 1, 1990
2.478 bln
+385.55 mln
18.43%
jan 1, 1991
1.97 bln
-507.853 mln
-20.5%
jan 1, 1992
112.919 mln
-1.857 bln
-94.27%
jan 1, 1993
-1.153 bln
-1.266 bln
-1.12K%
jan 1, 1994
537.947 mln
+1.691 bln
-146.64%
jan 1, 1995
2.858 bln
+2.32 bln
431.29%
jan 1, 1996
450.057 mln
-2.408 bln
-84.25%
jan 1, 1997
2.465 bln
+2.015 bln
447.63%
jan 1, 1998
3.132 bln
+667.035 mln
27.06%
jan 1, 1999
6.669 bln
+3.537 bln
112.95%
jan 1, 2000
2.09 bln
-4.579 bln
-68.66%
jan 1, 2001
14.773 bln
+12.683 bln
606.76%
jan 1, 2002
4.719 bln
-10.054 bln
-68.06%
jan 1, 2003
-753.479 mln
-5.472 bln
-115.97%
jan 1, 2004
-5.744 bln
-4.991 bln
662.35%
jan 1, 2005
-4.017 bln
+1.727 bln
-30.07%
jan 1, 2006
-390.44 mln
+3.626 bln
-90.28%
jan 1, 2007
-2.839 bln
-2.448 bln
627.05%
jan 1, 2008
-5.462 bln
-2.623 bln
92.41%
jan 1, 2009
10.735 bln
+16.197 bln
-296.54%
jan 1, 2010
4.918 bln
-5.816 bln
-54.18%
jan 1, 2011
2.766 bln
-2.152 bln
-43.76%
jan 1, 2012
2.456 bln
-310.329 mln
-11.22%
jan 1, 2013
3.445 bln
+989.444 mln
40.29%
jan 1, 2014
-2.303 bln
-5.748 bln
-166.84%
jan 1, 2015
-17.443 bln
-15.141 bln
657.49%
jan 1, 2016
-17.532 bln
-89.022 mln
0.51%
Ranking of countries by current statistics by years


Comments: