29
/
en
AIzaSyAYiBZKx7MnpbEhh9jyipgxe19OcubqV5w
April 1, 2024
262224
Thailand
THA
true
2
1
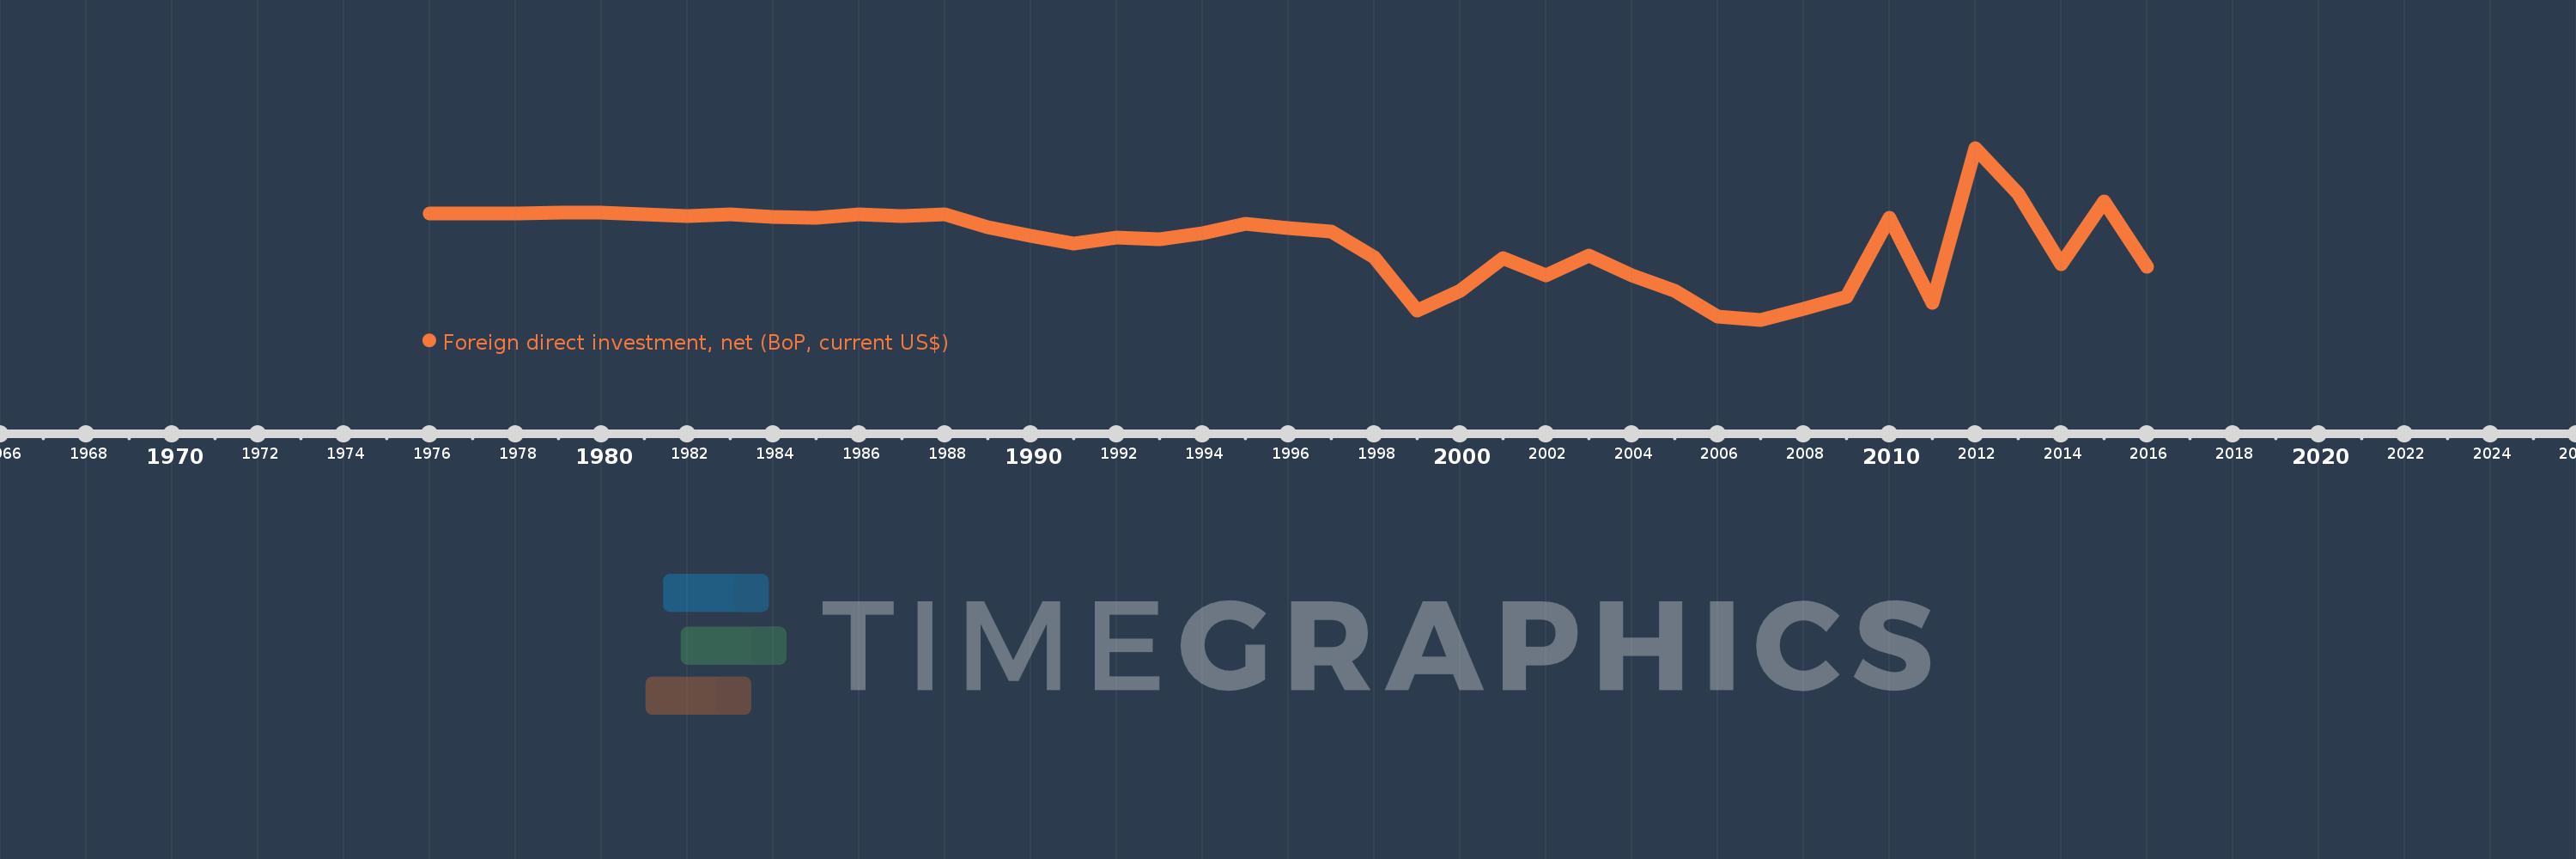
Foreign direct investment, net (BoP, current US$)
2016,2015,2014,2013,2012,2011,2010,2009,2008,2007,2006,2005,2004,2003,2002,2001,2000,1999,1998,1997,1996,1995,1994,1993,1992,1991,1990,1989,1988,1987,1986,1985,1984,1983,1982,1981,1980,1979,1978,1977,1976
This statistics in other country:
AfghanistanAlbaniaAlgeriaAngolaAntigua and BarbudaArgentinaArmeniaArubaAustraliaAustriaAzerbaijanBahamas, TheBahrainBangladeshBarbadosBelarusBelgiumBelizeBeninBermudaBhutanBoliviaBosnia and HerzegovinaBotswanaBrazilBrunei DarussalamBulgariaBurkina FasoBurundiCabo VerdeCambodiaCameroonCanadaCentral African RepublicChadChileChinaColombiaComorosCongo, Dem. Rep.Congo, Rep.Costa RicaCote d'IvoireCroatiaCuracaoCyprusCzech RepublicDenmarkDjiboutiDominicaDominican RepublicEcuadorEgypt, Arab Rep.El SalvadorEquatorial GuineaEritreaEstoniaEthiopiaEuro areaFijiFinlandFranceFrench PolynesiaGabonGambia, TheGeorgiaGermanyGhanaGreeceGrenadaGuatemalaGuineaGuinea-BissauGuyanaHaitiHondurasHong Kong SAR, ChinaHungaryIcelandIndiaIndonesiaIran, Islamic Rep.IraqIrelandIsraelItalyJamaicaJapanJordanKazakhstanKenyaKiribatiKorea, Rep.KosovoKuwaitKyrgyz RepublicLao PDRLatviaLebanonLesothoLiberiaLibyaLithuaniaLuxembourgMacao SAR, ChinaMacedonia, FYRMadagascarMalawiMalaysiaMaldivesMaliMaltaMarshall IslandsMauritaniaMauritiusMexicoMicronesia, Fed. Sts.MoldovaMongoliaMontenegroMoroccoMozambiqueMyanmarNamibiaNepalNetherlandsNew CaledoniaNew ZealandNicaraguaNigerNigeriaNorwayOmanPakistanPalauPanamaPapua New GuineaParaguayPeruPhilippinesPolandPortugalQatarRomaniaRussian FederationRwandaSamoaSao Tome and PrincipeSaudi ArabiaSenegalSerbiaSeychellesSierra LeoneSingaporeSint Maarten (Dutch part)Slovak RepublicSloveniaSolomon IslandsSouth AfricaSouth SudanSpainSri LankaSt. Kitts and NevisSt. LuciaSt. Vincent and the GrenadinesSudanSurinameSwazilandSwedenSwitzerlandSyrian Arab RepublicTajikistanTanzaniaThailandTimor-LesteTogoTongaTrinidad and TobagoTunisiaTurkeyTuvaluUgandaUkraineUnited KingdomUnited StatesUruguayVanuatuVenezuela, RBVietnamWest Bank and GazaYemen, Rep.ZambiaZimbabwe Timeline:
This timeline shows a graph from 1976 to 2016 of Thailand. No data until 1975. Number of actual observations by date: 41.
Source name:
World Development Indicators
Source organization:
International Monetary Fund, Balance of Payments Statistics Yearbook and data files.
Categories, topics:
Economy & Growth, Financial Sector
Last updated:
apr 23, 2017
Indicators value changes by year
Minimum:
-7.877 bln
jan 1, 2007
Maximum:
4.702 bln
jan 1, 2012
At the date of observation
Value
Absolute change
Change from previous value
jan 1, 1976
-85.626 mln
-85.626 mln
0.0%
jan 1, 1977
-79.117 mln
+6.509 mln
-7.6%
jan 1, 1978
-106.078 mln
-26.961 mln
34.08%
jan 1, 1979
-49.575 mln
+56.503 mln
-53.27%
jan 1, 1980
-51.362 mln
-1.788 mln
3.61%
jan 1, 1981
-186.828 mln
-135.465 mln
263.74%
jan 1, 1982
-288.222 mln
-101.394 mln
54.27%
jan 1, 1983
-188.738 mln
+99.484 mln
-34.52%
jan 1, 1984
-348.172 mln
-159.434 mln
84.47%
jan 1, 1985
-400.437 mln
-52.264 mln
15.01%
jan 1, 1986
-162.341 mln
+238.096 mln
-59.46%
jan 1, 1987
-261.441 mln
-99.1 mln
61.04%
jan 1, 1988
-181.991 mln
+79.45 mln
-30.39%
jan 1, 1989
-1.081 bln
-899.242 mln
494.11%
jan 1, 1990
-1.726 bln
-644.551 mln
59.61%
jan 1, 1991
-2.303 bln
-577.589 mln
33.47%
jan 1, 1992
-1.847 bln
+456.485 mln
-19.82%
jan 1, 1993
-1.966 bln
-119.58 mln
6.47%
jan 1, 1994
-1.571 bln
+395.511 mln
-20.11%
jan 1, 1995
-873.411 mln
+697.546 mln
-44.4%
jan 1, 1996
-1.182 bln
-308.964 mln
35.37%
jan 1, 1997
-1.405 bln
-222.259 mln
18.8%
jan 1, 1998
-3.315 bln
-1.91 bln
136.0%
jan 1, 1999
-7.185 bln
-3.87 bln
116.73%
jan 1, 2000
-5.757 bln
+1.428 bln
-19.87%
jan 1, 2001
-3.389 bln
+2.368 bln
-41.13%
jan 1, 2002
-4.639 bln
-1.251 bln
36.9%
jan 1, 2003
-3.171 bln
+1.469 bln
-31.65%
jan 1, 2004
-4.609 bln
-1.439 bln
45.37%
jan 1, 2005
-5.784 bln
-1.174 bln
25.47%
jan 1, 2006
-7.664 bln
-1.881 bln
32.52%
jan 1, 2007
-7.877 bln
-212.51 mln
2.77%
jan 1, 2008
-7.087 bln
+789.823 mln
-10.03%
jan 1, 2009
-6.222 bln
+865.028 mln
-12.21%
jan 1, 2010
-415.18 mln
+5.807 bln
-93.33%
jan 1, 2011
-6.615 bln
-6.2 bln
1.49K%
jan 1, 2012
4.702 bln
+11.317 bln
-171.08%
jan 1, 2013
1.362 bln
-3.341 bln
-71.04%
jan 1, 2014
-3.814 bln
-5.176 bln
-380.16%
jan 1, 2015
766.3 mln
+4.581 bln
-120.09%
jan 1, 2016
-4.012 bln
-4.779 bln
-623.62%
Ranking of countries by current statistics by years


Comments: