29
/
en
AIzaSyAYiBZKx7MnpbEhh9jyipgxe19OcubqV5w
April 1, 2024
89190
Bosnia and Herzegovina
BIH
true
2
1
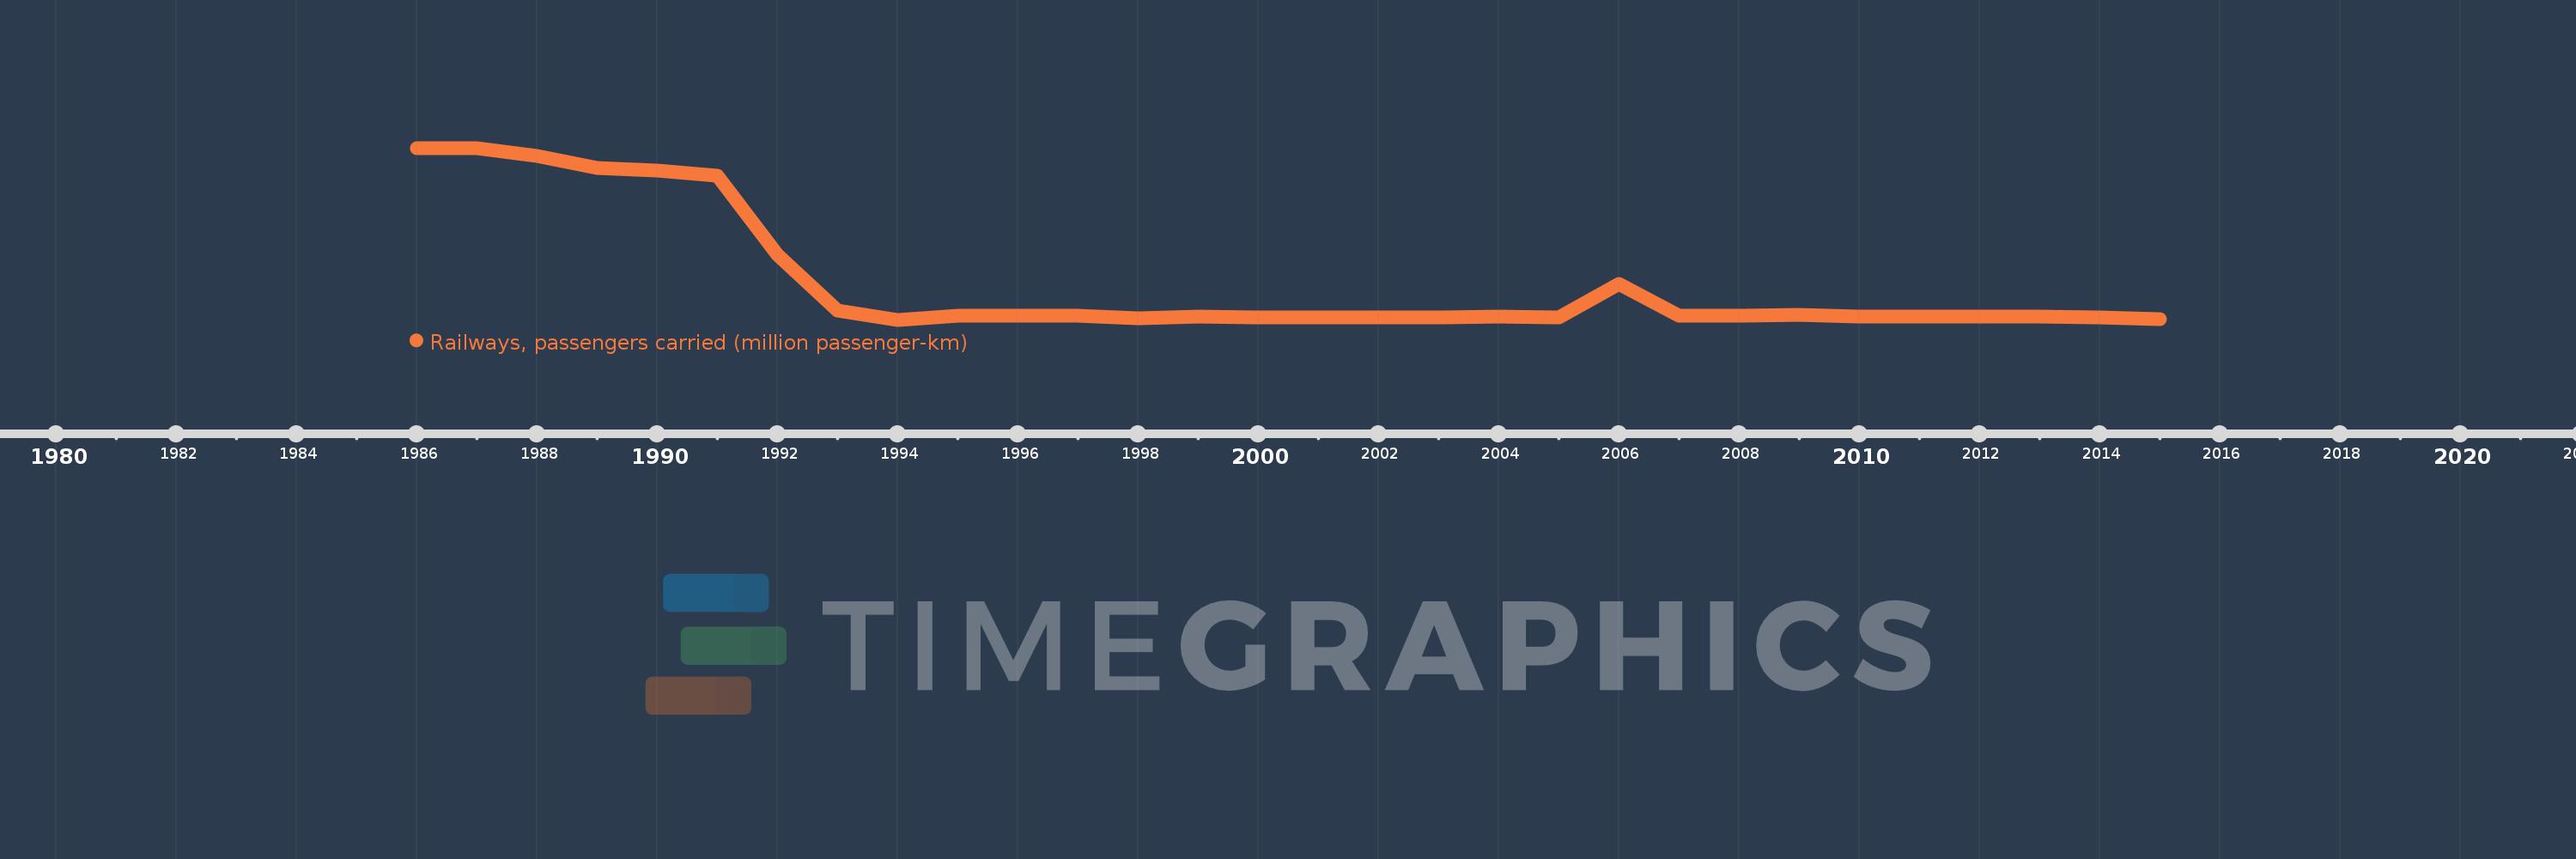
Railways, passengers carried (million passenger-km)
2015,2014,2013,2012,2011,2010,2009,2008,2007,2006,2005,2004,2003,2002,2001,2000,1999,1998,1997,1996,1995,1994,1993,1992,1991,1990,1989,1988,1987,1986
This statistics in other country:
Timeline:
This timeline shows a graph from 1986 to 2015 of Bosnia and Herzegovina. No data until 1985. Number of actual observations by date: 30.
Source name:
World Development Indicators
Source organization:
World Bank, Transportation, Water, and Information and Communications Technologies Department, Transport Division.
Categories, topics:
Infrastructure
Last updated:
apr 23, 2017
Indicators value changes by year
Maximum:
1.646K
jan 1, 1987
At the date of observation
Value
Absolute change
Change from previous value
jan 1, 1986
1.644K
+1.644K
0.0%
jan 1, 1987
1.646K
+2.0
0.12%
jan 1, 1988
1.568K
-78.0
-4.74%
jan 1, 1989
1.459K
-109.0
-6.95%
jan 1, 1990
1.433K
-26.0
-1.78%
jan 1, 1991
1.382K
-51.0
-3.56%
jan 1, 1992
637.0
-745.0
-53.91%
jan 1, 1993
116.0
-521.0
-81.79%
jan 1, 1994
28.0
-88.0
-75.86%
jan 1, 1995
63.0
+35.0
125.0%
jan 1, 1998
40.0
-23.0
-36.51%
jan 1, 1999
56.0
+16.0
40.0%
jan 1, 2000
51.0
-5.0
-8.93%
jan 1, 2001
47.0
-4.0
-7.84%
jan 1, 2002
53.0
+6.0
12.77%
jan 1, 2004
55.0
+2.0
3.77%
jan 1, 2005
53.0
-2.0
-3.64%
jan 1, 2006
366.0
+313.0
590.57%
jan 1, 2007
66.0
-300.0
-81.97%
jan 1, 2008
68.0
+2.0
3.03%
jan 1, 2009
78.0
+10.0
14.71%
jan 1, 2010
61.0
-17.0
-21.79%
jan 1, 2011
59.0
-2.0
-3.28%
jan 1, 2012
54.0
-5.0
-8.47%
jan 1, 2013
55.0
+1.0
1.85%
jan 1, 2014
47.0
-8.0
-14.55%
jan 1, 2015
34.0
-13.0
-27.66%
Ranking of countries by current statistics by years


Comments: