29
/
en
AIzaSyAYiBZKx7MnpbEhh9jyipgxe19OcubqV5w
April 1, 2024
73391
Australia
AUS
true
2
1
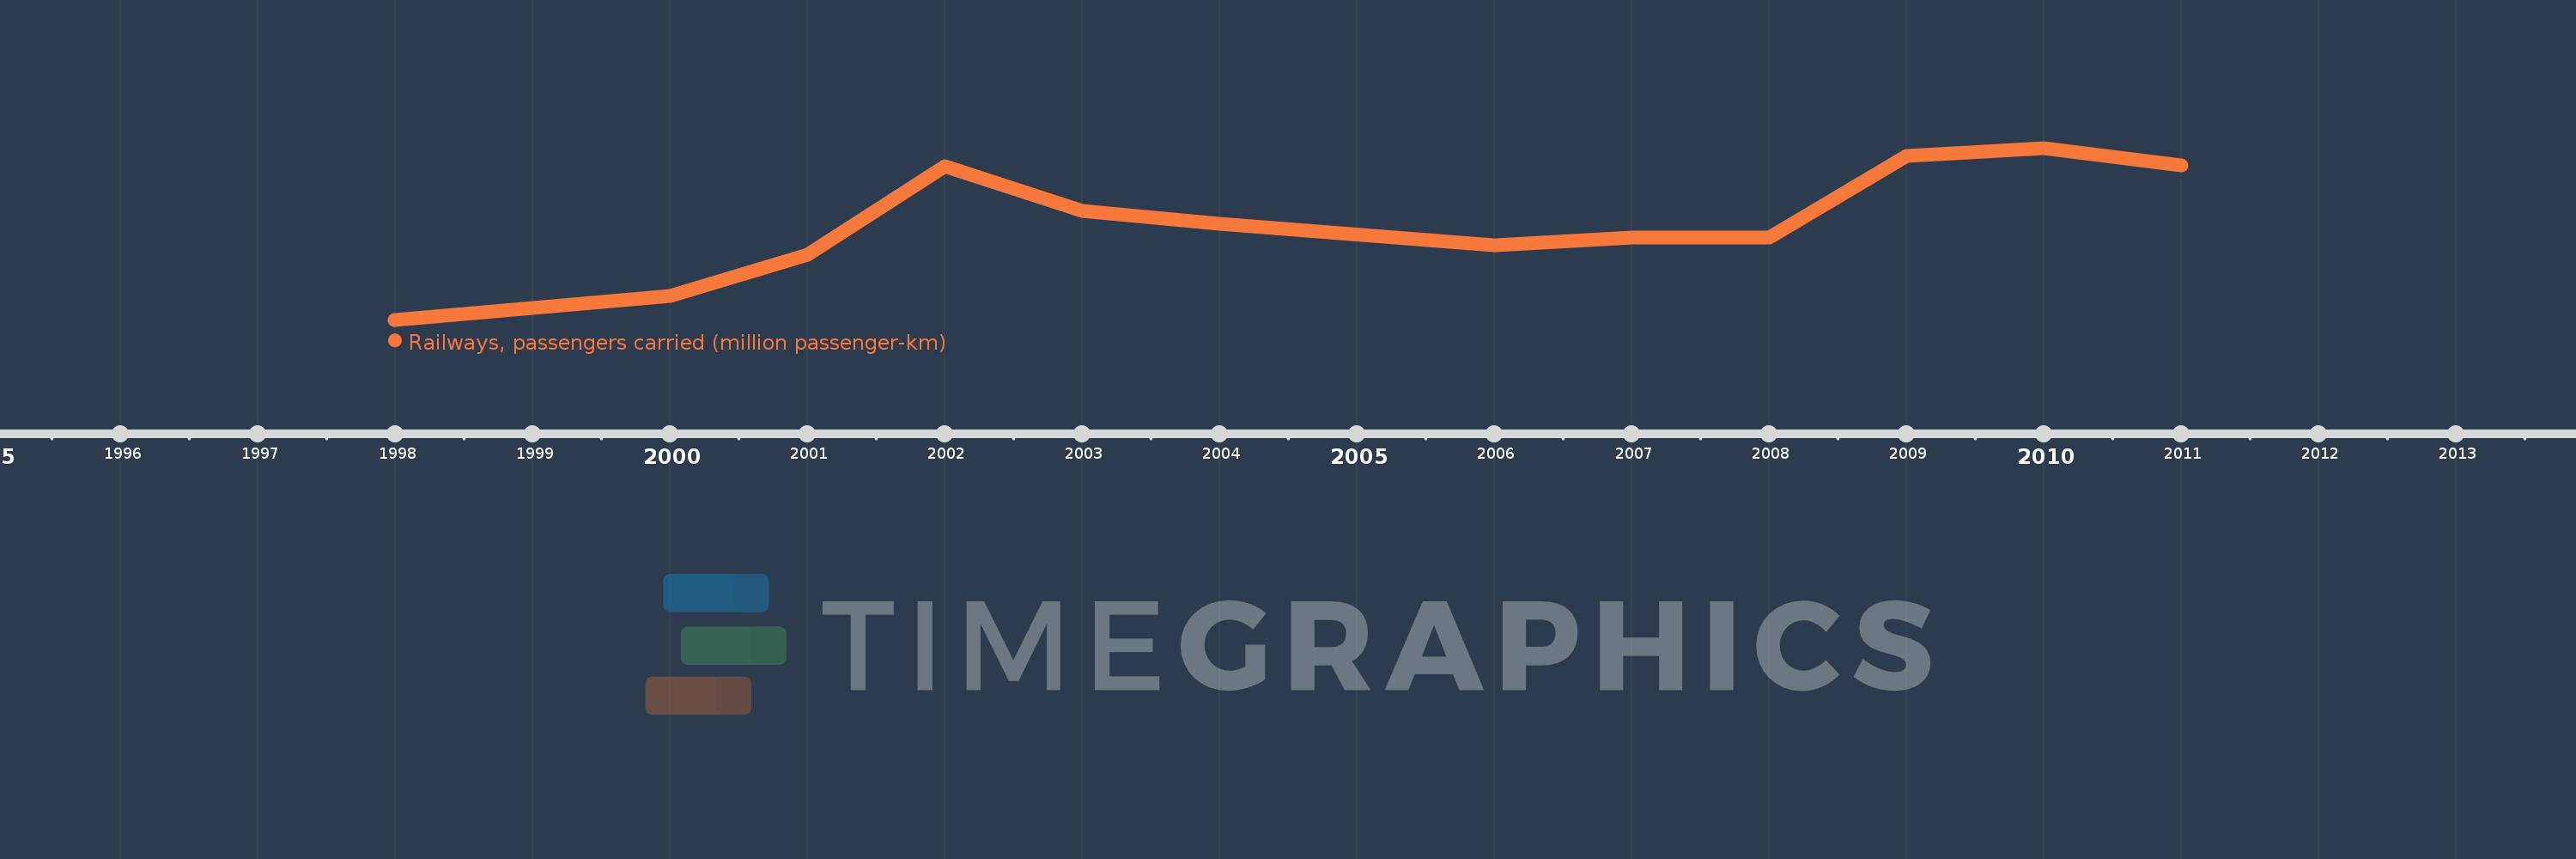
Railways, passengers carried (million passenger-km)
2011,2010,2009,2008,2007,2006,2004,2003,2002,2001,2000,1998
This statistics in other country:
Timeline:
This timeline shows a graph from 1998 to 2011 of Australia. No data until 1997. Number of actual observations by date: 12.
Source name:
World Development Indicators
Source organization:
World Bank, Transportation, Water, and Information and Communications Technologies Department, Transport Division.
Categories, topics:
Infrastructure
Last updated:
apr 23, 2017
Indicators value changes by year
Minimum:
1.093K
jan 1, 1998
Maximum:
1.546K
jan 1, 2010
At the date of observation
Value
Absolute change
Change from previous value
jan 1, 1998
1.093K
+1.093K
0.0%
jan 1, 2000
1.155K
+62.0
5.67%
jan 1, 2001
1.265K
+110.0
9.52%
jan 1, 2002
1.497K
+232.0
18.34%
jan 1, 2003
1.379K
-118.0
-7.88%
jan 1, 2004
1.347K
-32.0
-2.32%
jan 1, 2006
1.29K
-57.0
-4.23%
jan 1, 2007
1.309K
+19.0
1.47%
jan 1, 2008
1.309K
0.0
0.0%
jan 1, 2009
1.526K
+217.0
16.58%
jan 1, 2010
1.546K
+20.0
1.31%
jan 1, 2011
1.5K
-46.0
-2.98%
Ranking of countries by current statistics by years


Comments: