29
/
en
AIzaSyAYiBZKx7MnpbEhh9jyipgxe19OcubqV5w
April 1, 2024
184520
Macedonia, FYR
MKD
true
2
1
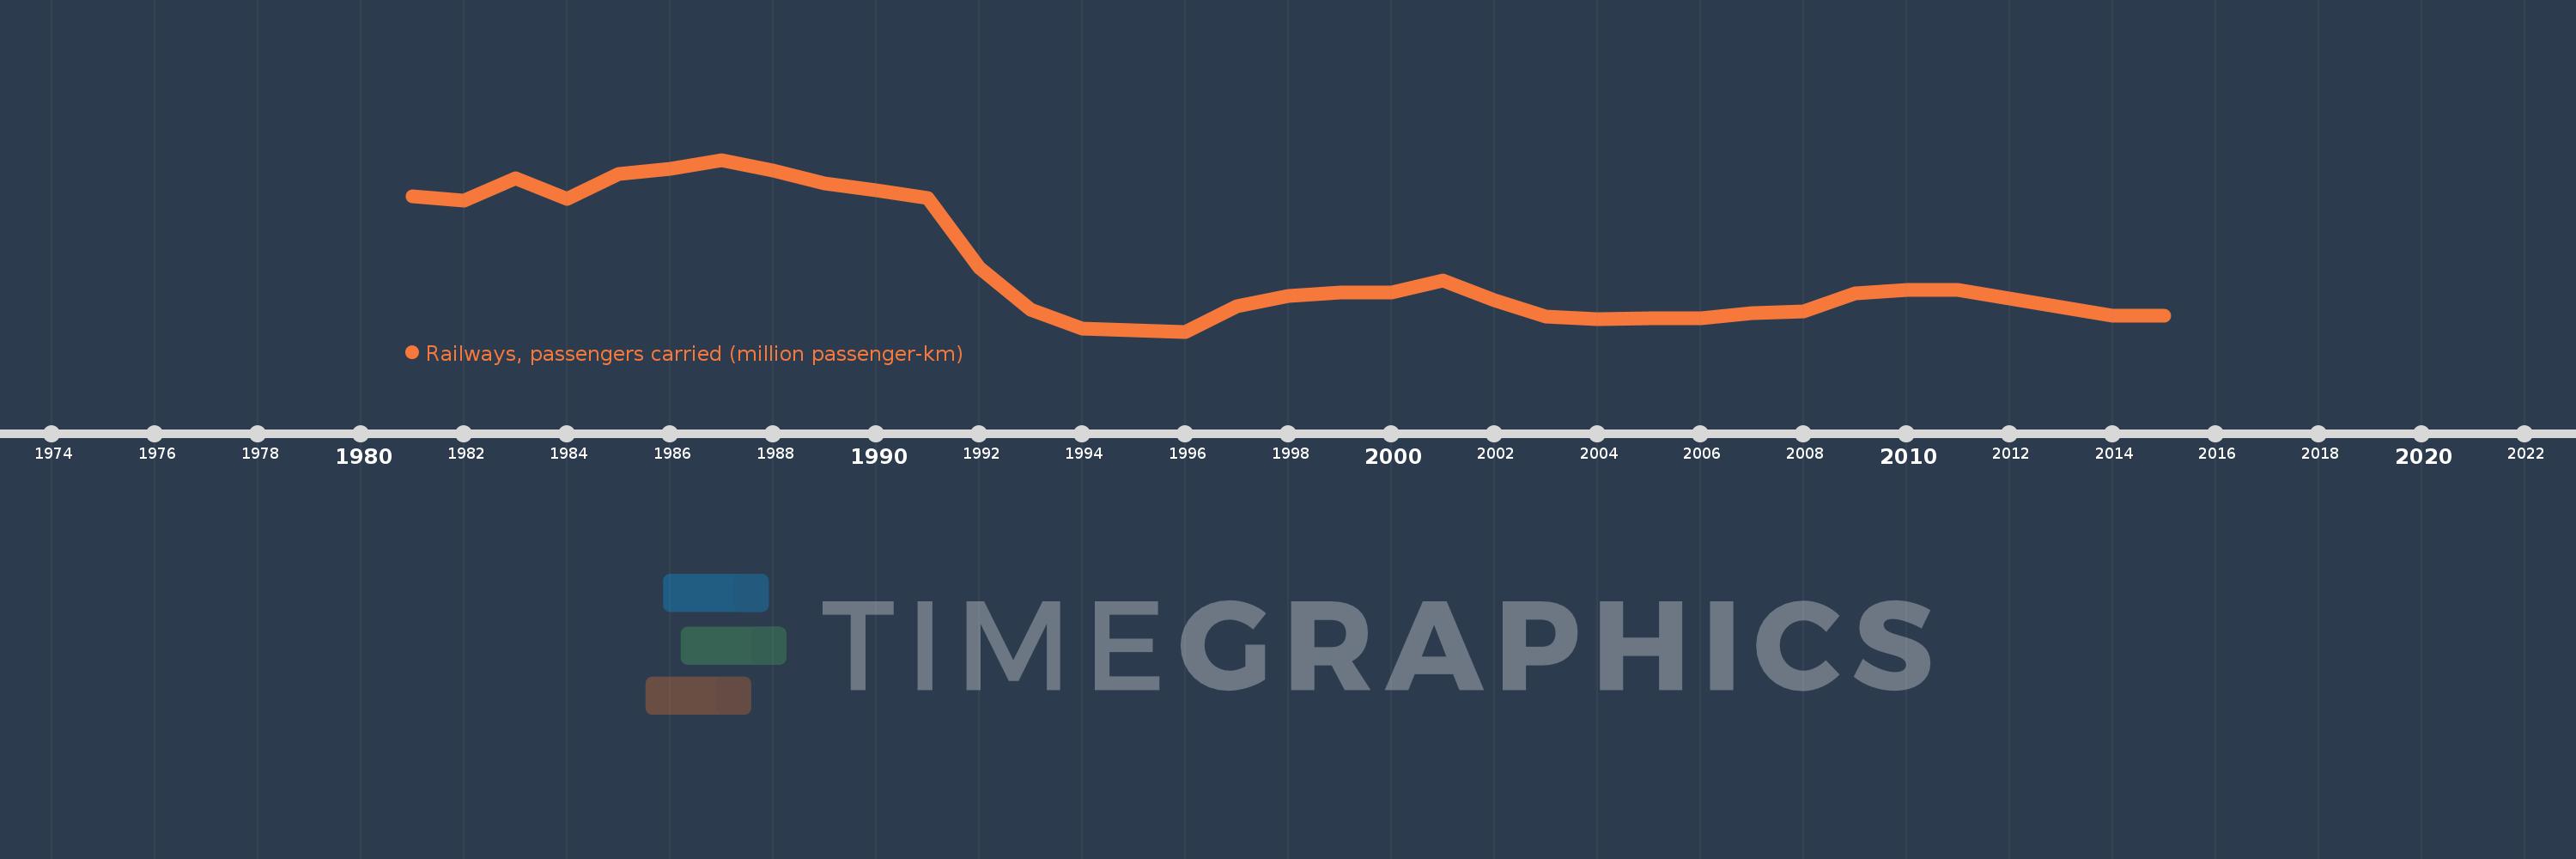
Railways, passengers carried (million passenger-km)
2015,2014,2011,2010,2009,2008,2007,2006,2005,2004,2003,2002,2001,2000,1999,1998,1997,1996,1995,1994,1993,1992,1991,1990,1989,1988,1987,1986,1985,1984,1983,1982,1981
This statistics in other country:
Timeline:
This timeline shows a graph from 1981 to 2015 of Macedonia, FYR. No data until 1980. Number of actual observations by date: 33.
Source name:
World Development Indicators
Source organization:
World Bank, Transportation, Water, and Information and Communications Technologies Department, Transport Division.
Categories, topics:
Infrastructure
Last updated:
apr 23, 2017
Indicators value changes by year
At the date of observation
Value
Absolute change
Change from previous value
jan 1, 1981
358.0
+358.0
0.0%
jan 1, 1982
348.0
-10.0
-2.79%
jan 1, 1983
396.0
+48.0
13.79%
jan 1, 1984
352.0
-44.0
-11.11%
jan 1, 1985
405.0
+53.0
15.06%
jan 1, 1986
417.0
+12.0
2.96%
jan 1, 1987
436.0
+19.0
4.56%
jan 1, 1988
412.0
-24.0
-5.5%
jan 1, 1989
385.0
-27.0
-6.55%
jan 1, 1990
371.0
-14.0
-3.64%
jan 1, 1991
354.0
-17.0
-4.58%
jan 1, 1992
204.0
-150.0
-42.37%
jan 1, 1993
113.0
-91.0
-44.61%
jan 1, 1994
72.0
-41.0
-36.28%
jan 1, 1995
67.073
-4.927
-6.84%
jan 1, 1996
64.91
-2.163
-3.22%
jan 1, 1997
120.0
+55.09
84.87%
jan 1, 1998
141.0
+21.0
17.5%
jan 1, 1999
149.0
+8.0
5.67%
jan 1, 2000
149.7
+0.7
0.47%
jan 1, 2001
176.0
+26.3
17.57%
jan 1, 2002
133.0
-43.0
-24.43%
jan 1, 2003
98.0
-35.0
-26.32%
jan 1, 2004
92.0
-6.0
-6.12%
jan 1, 2005
93.1
+1.1
1.2%
jan 1, 2006
94.0
+0.9
0.97%
jan 1, 2007
105.0
+11.0
11.7%
jan 1, 2008
109.0
+4.0
3.81%
jan 1, 2009
148.0
+39.0
35.78%
jan 1, 2010
154.0
+6.0
4.05%
jan 1, 2011
155.0
+1.0
0.65%
jan 1, 2014
99.0
-56.0
-36.13%
Ranking of countries by current statistics by years


Comments: