29
/
en
AIzaSyAYiBZKx7MnpbEhh9jyipgxe19OcubqV5w
April 1, 2024
37750
IDA & IBRD total
IBT
false
2
1
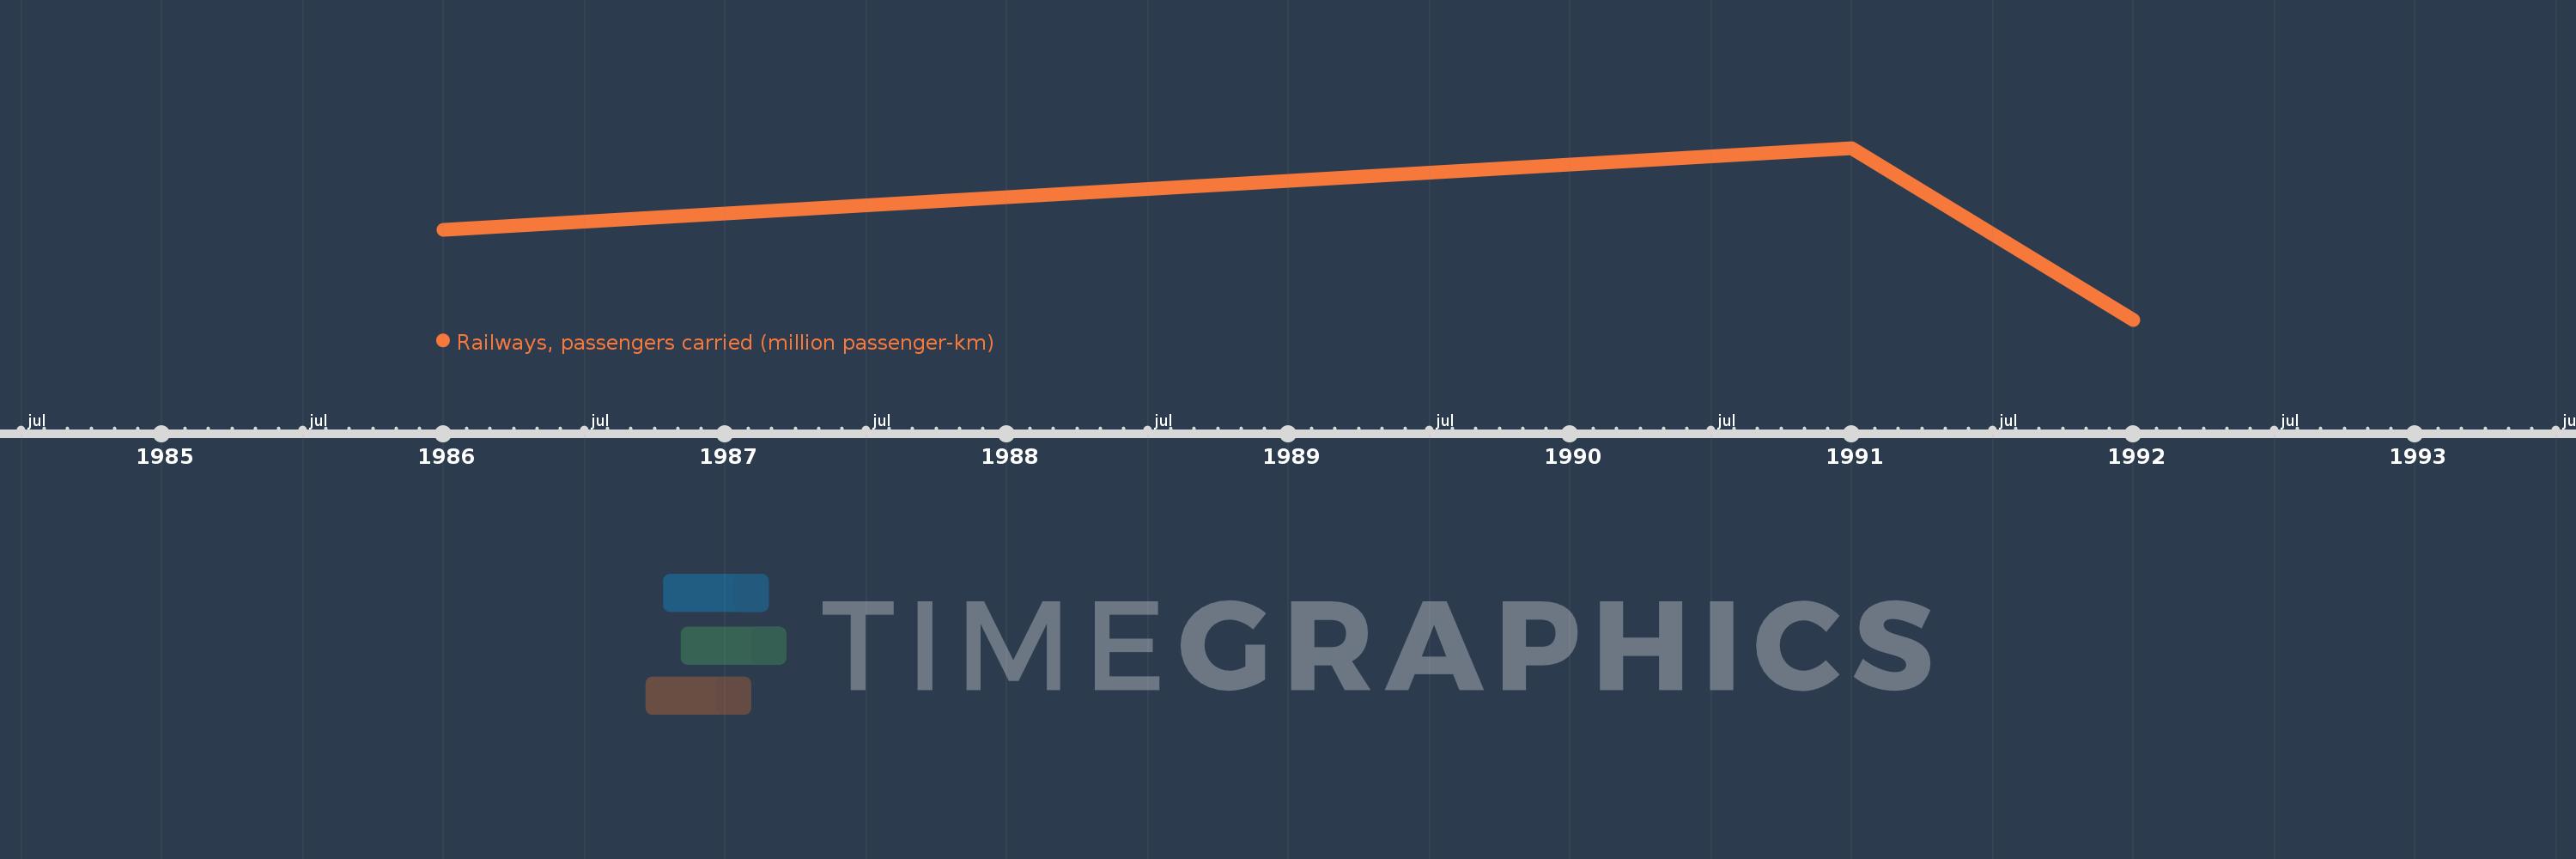
Railways, passengers carried (million passenger-km)
1992,1991,1986
This statistics in other country:
Timeline:
This timeline shows a graph from 1986 to 1992 of IDA & IBRD total. No data until 1985. Number of actual observations by date: 3.
Source name:
World Development Indicators
Source organization:
World Bank, Transportation, Water, and Information and Communications Technologies Department, Transport Division.
Categories, topics:
Infrastructure
Last updated:
apr 23, 2017
Indicators value changes by year
Minimum:
1.427K
jan 1, 1992
At the date of observation
Value
Absolute change
Change from previous value
jan 1, 1986
1.644K
+1.644K
0.0%
jan 1, 1991
1.84K
+195.912
11.92%
jan 1, 1992
1.427K
-412.912
-22.44%
Ranking of countries by current statistics by years


Comments: