29
/
en
AIzaSyAYiBZKx7MnpbEhh9jyipgxe19OcubqV5w
April 1, 2024
165491
Jordan
JOR
true
2
1
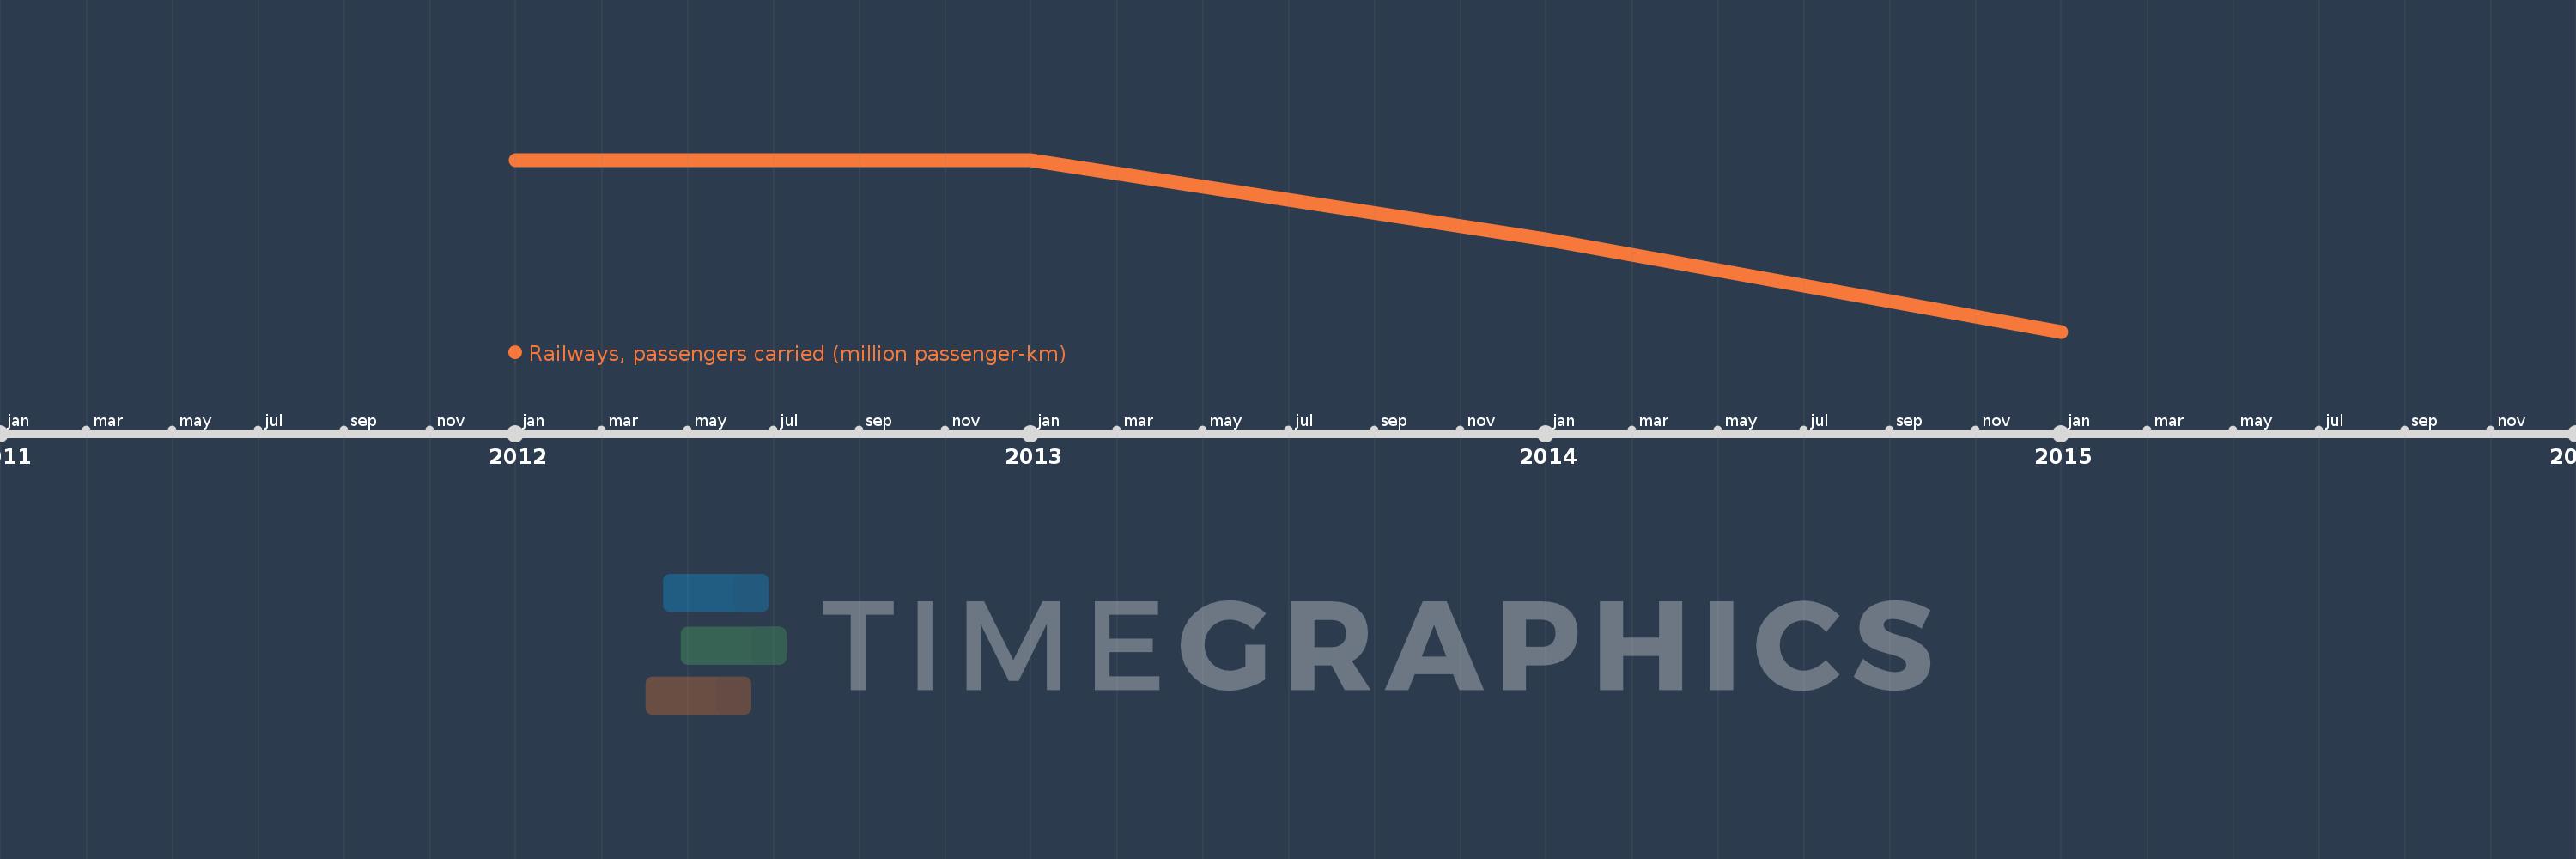
Railways, passengers carried (million passenger-km)
2015,2014,2013,2012
This statistics in other country:
Timeline:
This timeline shows a graph from 2012 to 2015 of Jordan. No data until 2011. Number of actual observations by date: 4.
Source name:
World Development Indicators
Source organization:
World Bank, Transportation, Water, and Information and Communications Technologies Department, Transport Division.
Categories, topics:
Infrastructure
Last updated:
apr 23, 2017
Indicators value changes by year
At the date of observation
Value
Absolute change
Change from previous value
jan 1, 2012
504.0
+504.0
0.0%
jan 1, 2013
504.0
0.0
0.0%
jan 1, 2014
503.537
-0.463
-0.09%
jan 1, 2015
503.0
-0.537
-0.11%
Ranking of countries by current statistics by years


Comments: