29
/
en
AIzaSyAYiBZKx7MnpbEhh9jyipgxe19OcubqV5w
April 1, 2024
110306
Congo, Dem. Rep.
COD
true
2
1
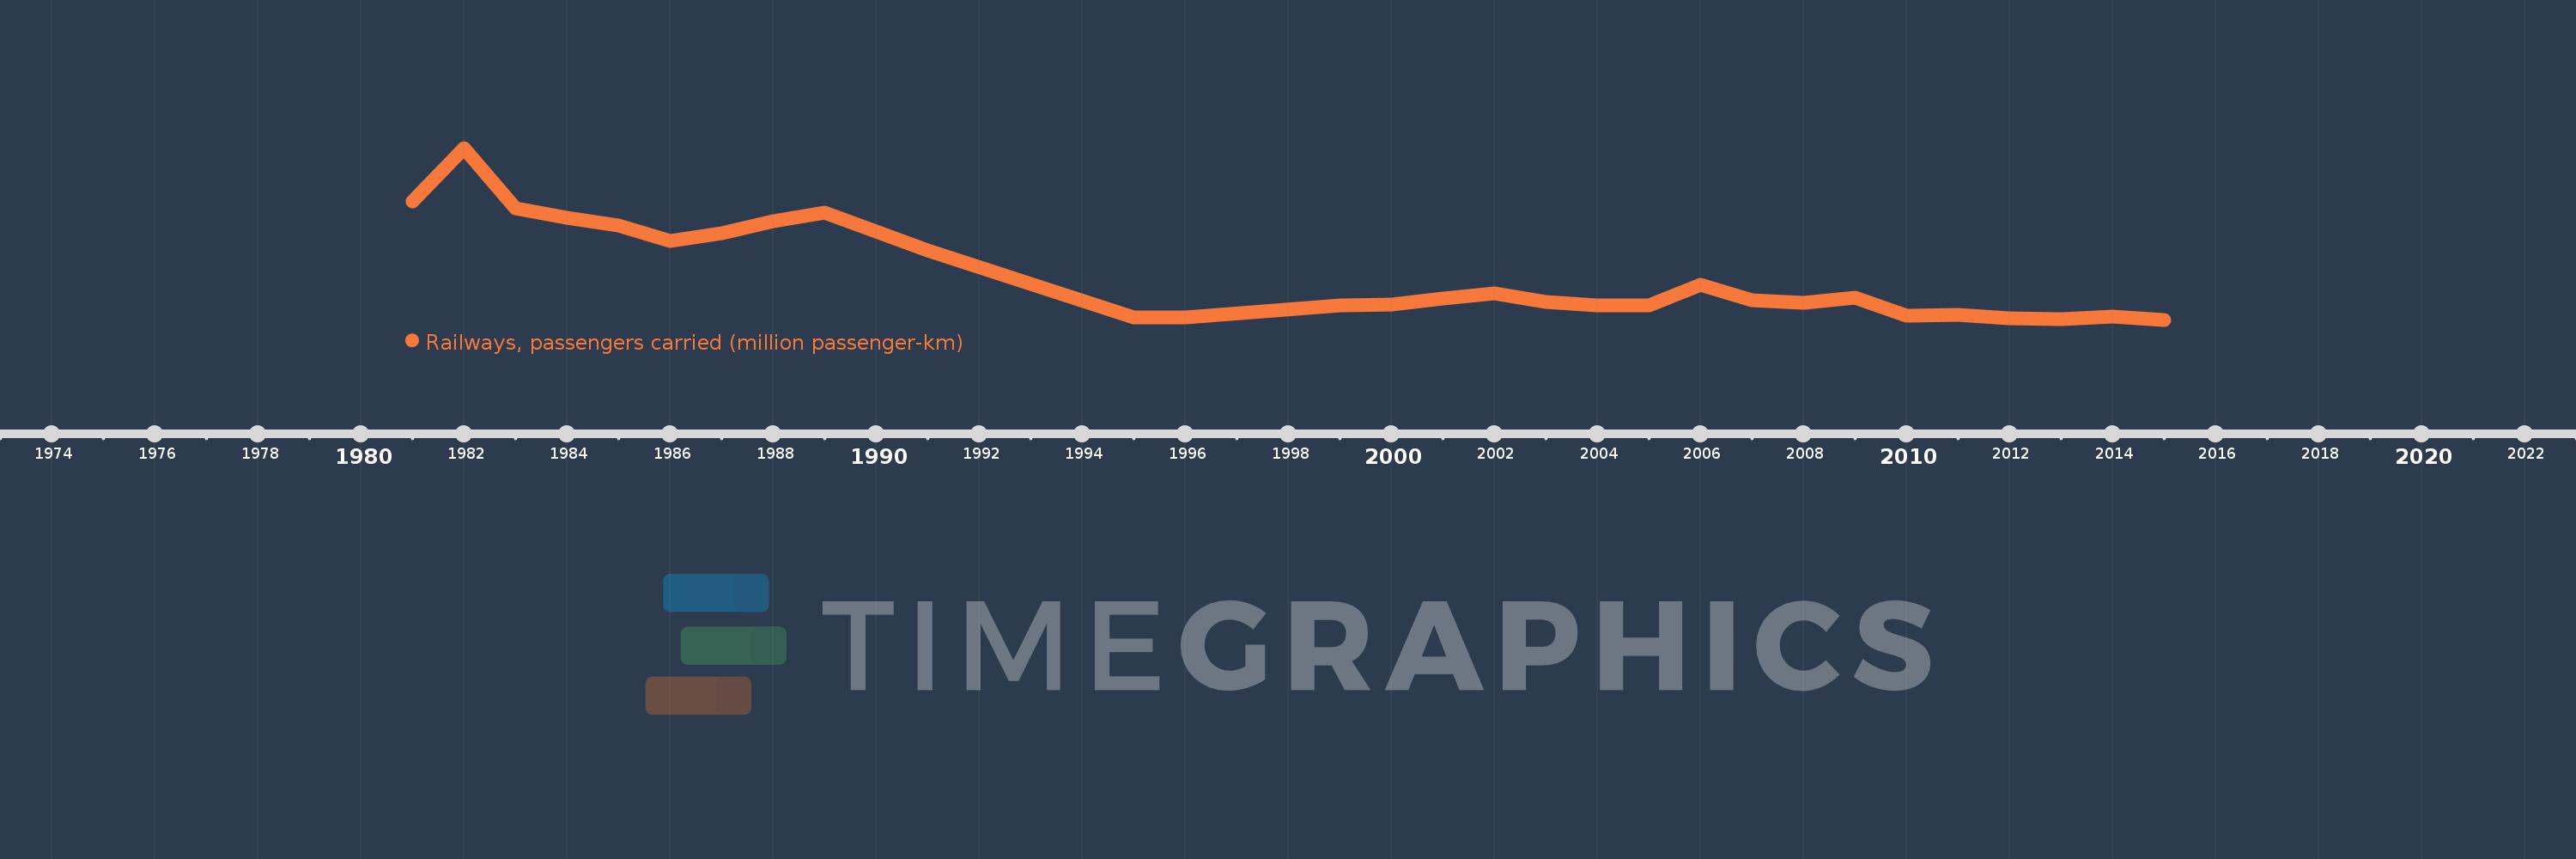
Railways, passengers carried (million passenger-km)
2015,2014,2013,2012,2011,2010,2009,2008,2007,2006,2005,2004,2003,2002,2001,2000,1999,1996,1995,1991,1989,1988,1987,1986,1985,1984,1983,1982,1981
This statistics in other country:
Timeline:
This timeline shows a graph from 1981 to 2015 of Congo, Dem. Rep.. No data until 1980. Number of actual observations by date: 29.
Source name:
World Development Indicators
Source organization:
World Bank, Transportation, Water, and Information and Communications Technologies Department, Transport Division.
Categories, topics:
Infrastructure
Last updated:
apr 23, 2017
Indicators value changes by year
At the date of observation
Value
Absolute change
Change from previous value
jan 1, 1981
429.4
+429.4
0.0%
jan 1, 1982
613.2
+183.8
42.8%
jan 1, 1983
405.6
-207.6
-33.86%
jan 1, 1984
372.6
-33.0
-8.14%
jan 1, 1985
345.6
-27.0
-7.25%
jan 1, 1986
292.0
-53.6
-15.51%
jan 1, 1987
320.0
+28.0
9.59%
jan 1, 1988
359.0
+39.0
12.19%
jan 1, 1989
389.0
+30.0
8.36%
jan 1, 1991
260.0
-129.0
-33.16%
jan 1, 1995
29.0
-231.0
-88.85%
jan 1, 1999
71.0
+42.0
144.83%
jan 1, 2000
73.0
+2.0
2.82%
jan 1, 2001
94.0
+21.0
28.77%
jan 1, 2002
111.0
+17.0
18.09%
jan 1, 2003
80.0
-31.0
-27.93%
jan 1, 2004
71.0
-9.0
-11.25%
jan 1, 2005
70.0
-1.0
-1.41%
jan 1, 2006
140.0
+70.0
100.0%
jan 1, 2007
86.0
-54.0
-38.57%
jan 1, 2008
79.0
-7.0
-8.14%
jan 1, 2009
95.0
+16.0
20.25%
jan 1, 2010
35.0
-60.0
-63.16%
jan 1, 2011
37.0
+2.0
5.71%
jan 1, 2012
25.0
-12.0
-32.43%
jan 1, 2013
22.0
-3.0
-12.0%
jan 1, 2014
30.0
+8.0
36.36%
jan 1, 2015
20.0
-10.0
-33.33%
Ranking of countries by current statistics by years


Comments: