29
/
en
AIzaSyAYiBZKx7MnpbEhh9jyipgxe19OcubqV5w
April 1, 2024
88906
Bosnia and Herzegovina
BIH
true
2
1
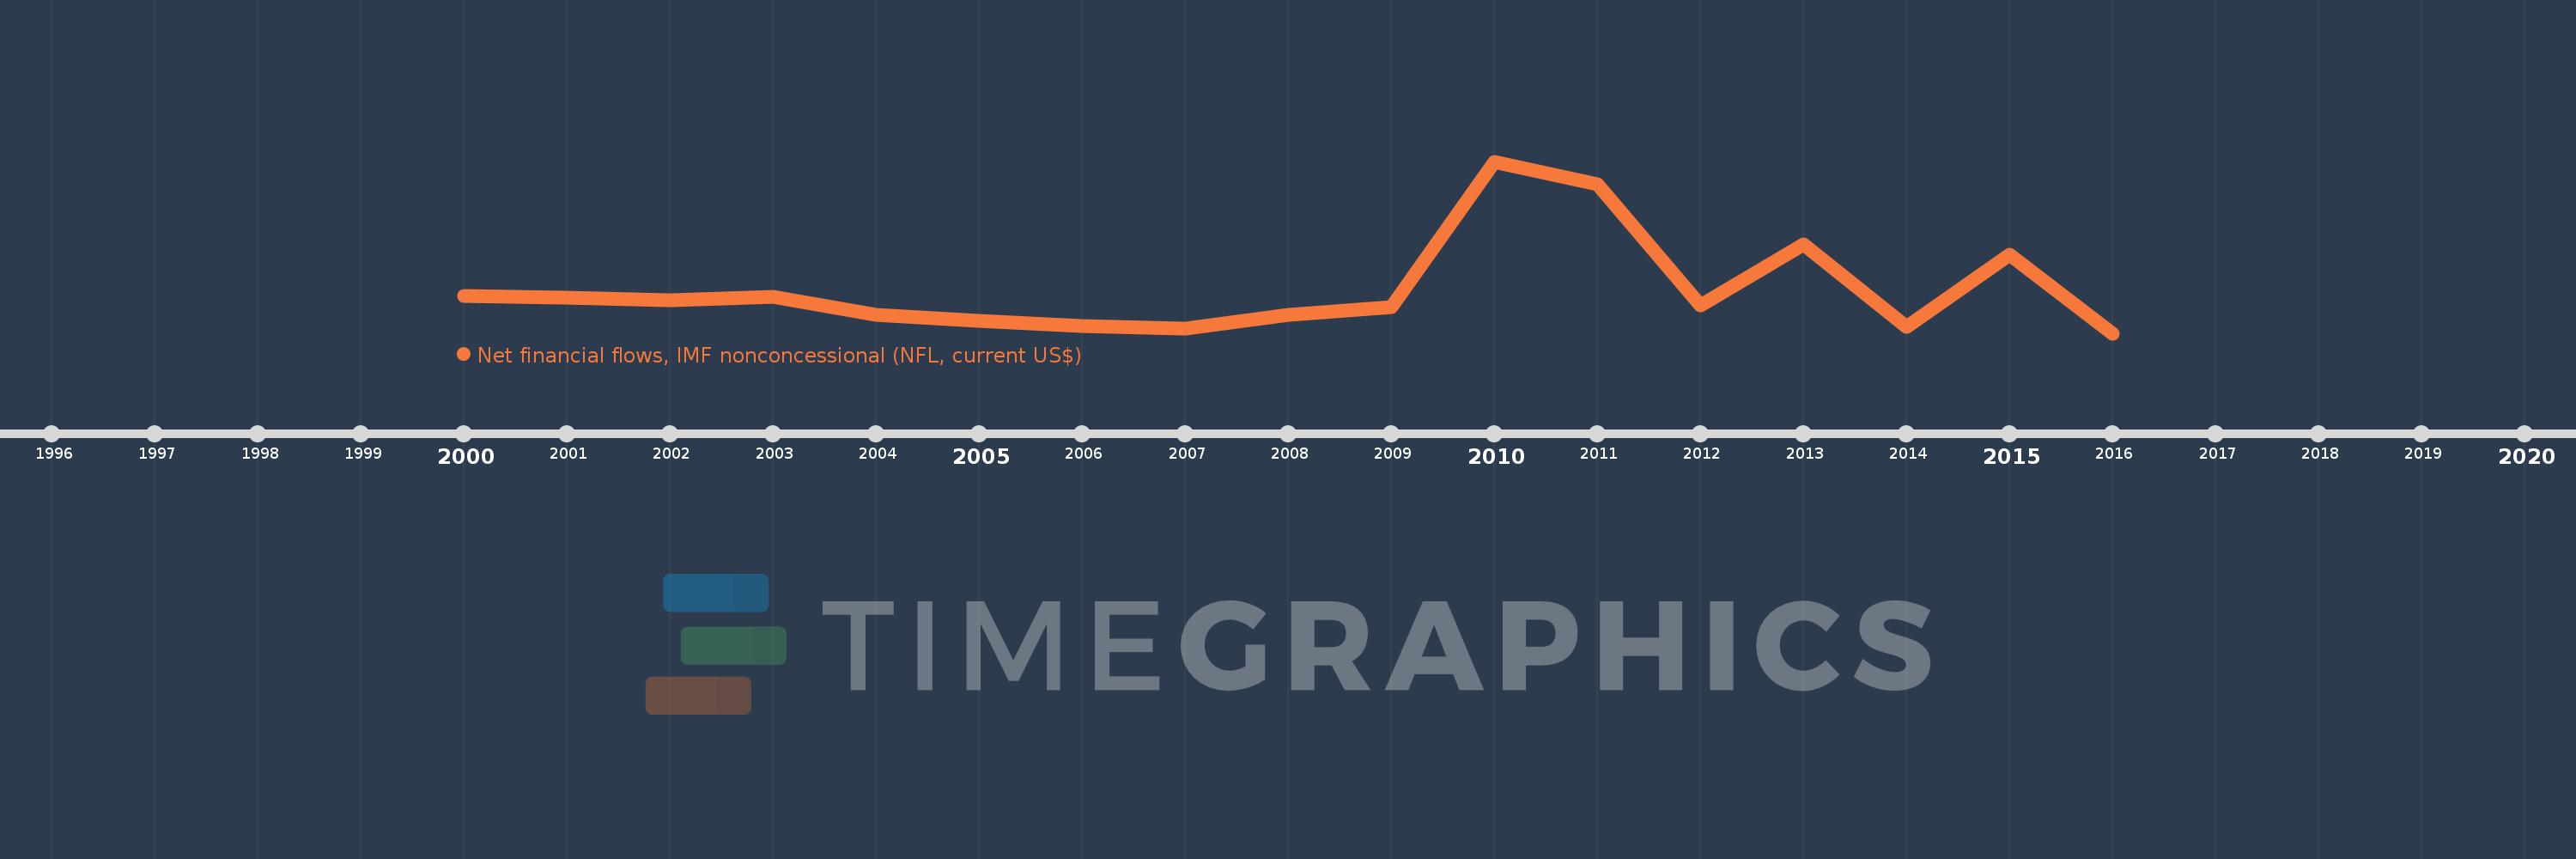
Net financial flows, IMF nonconcessional (NFL, current US$)
2016,2015,2014,2013,2012,2011,2010,2009,2008,2007,2006,2005,2004,2003,2002,2001,2000
This statistics in other country:
Timeline:
This timeline shows a graph from 2000 to 2016 of Bosnia and Herzegovina. No data until 1999. Number of actual observations by date: 17.
Source name:
World Development Indicators
Source organization:
World Bank, International Debt Statistics.
Categories, topics:
External Debt
Last updated:
apr 23, 2017
Indicators value changes by year
Minimum:
-53.824 mln
jan 1, 2016
Maximum:
281.704 mln
jan 1, 2010
At the date of observation
Value
Absolute change
Change from previous value
jan 1, 2000
18.979 mln
+18.979 mln
0.0%
jan 1, 2001
15.841 mln
-3.138 mln
-16.53%
jan 1, 2002
10.096 mln
-5.745 mln
-36.27%
jan 1, 2003
18.179 mln
+8.083 mln
80.06%
jan 1, 2004
-17.175 mln
-35.354 mln
-194.48%
jan 1, 2005
-29.787 mln
-12.612 mln
73.43%
jan 1, 2006
-39.405 mln
-9.618 mln
32.29%
jan 1, 2007
-43.922 mln
-4.517 mln
11.46%
jan 1, 2008
-18.371 mln
+25.551 mln
-58.17%
jan 1, 2009
-2.371 mln
+16.0 mln
-87.09%
jan 1, 2010
281.704 mln
+284.075 mln
-11.98K%
jan 1, 2011
237.389 mln
-44.315 mln
-15.73%
jan 1, 2012
0.0
-237.389 mln
-100.0%
jan 1, 2013
120.114 mln
+120.114 mln
%
jan 1, 2014
-41.274 mln
-161.388 mln
-134.36%
jan 1, 2015
98.915 mln
+140.189 mln
-339.65%
jan 1, 2016
-53.824 mln
-152.739 mln
-154.41%
Ranking of countries by current statistics by years


Comments: