29
/
en
AIzaSyAYiBZKx7MnpbEhh9jyipgxe19OcubqV5w
April 1, 2024
138398
Georgia
GEO
true
2
1
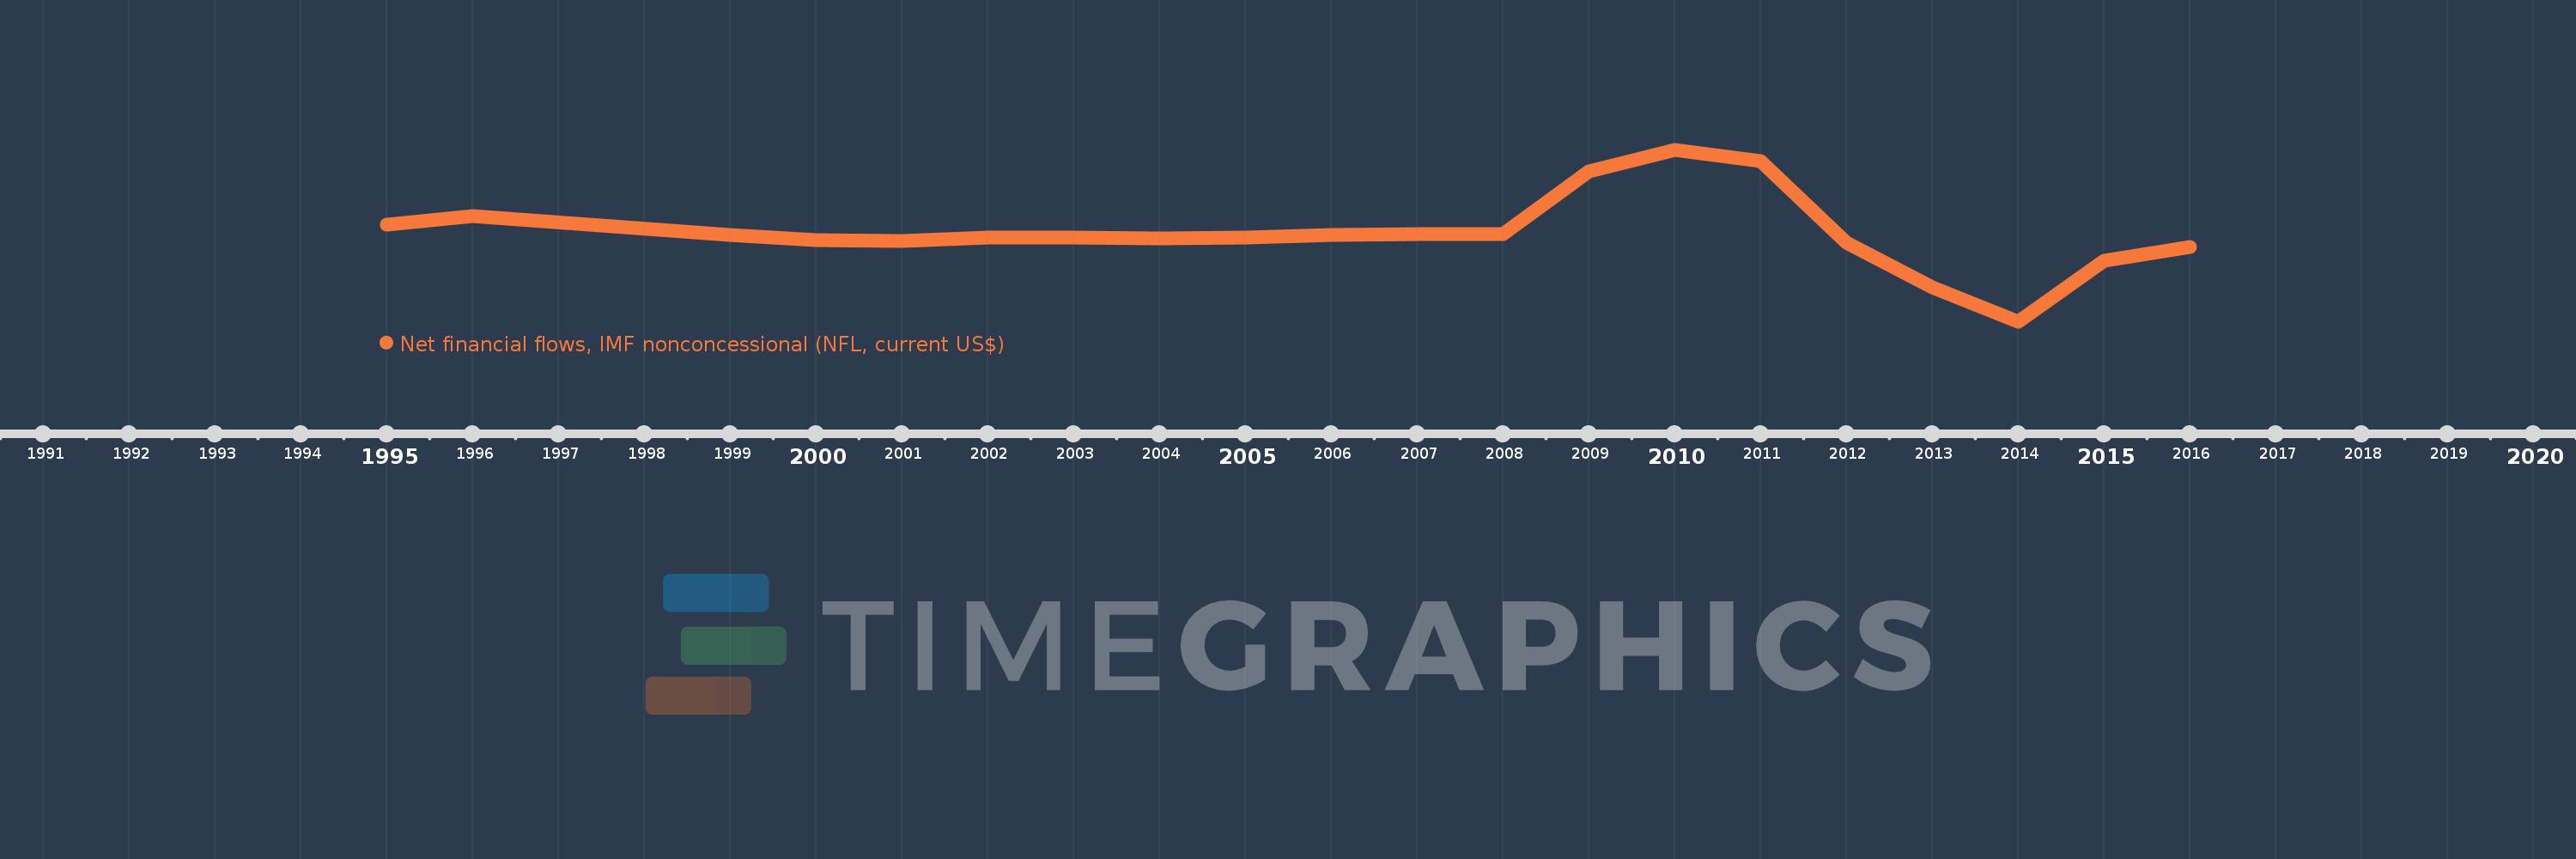
Net financial flows, IMF nonconcessional (NFL, current US$)
2016,2015,2014,2013,2012,2011,2010,2009,2008,2007,2006,2005,2004,2003,2002,2001,2000,1999,1996,1995
This statistics in other country:
Timeline:
This timeline shows a graph from 1995 to 2016 of Georgia. No data until 1994. Number of actual observations by date: 20.
Source name:
World Development Indicators
Source organization:
World Bank, International Debt Statistics.
Categories, topics:
External Debt
Last updated:
apr 23, 2017
Indicators value changes by year
Minimum:
-353.173 mln
jan 1, 2014
Maximum:
340.58 mln
jan 1, 2010
At the date of observation
Value
Absolute change
Change from previous value
jan 1, 1995
39.74 mln
+39.74 mln
0.0%
jan 1, 1996
75.786 mln
+36.046 mln
90.7%
jan 1, 1999
-942.0K
-76.728 mln
-101.24%
jan 1, 2000
-21.502 mln
-20.56 mln
2.18K%
jan 1, 2001
-25.926 mln
-4.424 mln
20.57%
jan 1, 2002
-11.776 mln
+14.15 mln
-54.58%
jan 1, 2003
-11.978 mln
-202.0K
1.72%
jan 1, 2004
-16.174 mln
-4.196 mln
35.03%
jan 1, 2005
-13.709 mln
+2.465 mln
-15.24%
jan 1, 2006
-3.417 mln
+10.292 mln
-75.07%
jan 1, 2007
0.0
+3.417 mln
-100.0%
jan 1, 2009
255.608 mln
+255.608 mln
%
jan 1, 2010
340.58 mln
+84.972 mln
33.24%
jan 1, 2011
296.946 mln
-43.634 mln
-12.81%
jan 1, 2012
-31.871 mln
-328.817 mln
-110.73%
jan 1, 2013
-213.86 mln
-181.989 mln
571.02%
jan 1, 2014
-353.173 mln
-139.313 mln
65.14%
jan 1, 2015
-104.15 mln
+249.023 mln
-70.51%
jan 1, 2016
-51.523 mln
+52.627 mln
-50.53%
Ranking of countries by current statistics by years


Comments: