29
/
en
AIzaSyAYiBZKx7MnpbEhh9jyipgxe19OcubqV5w
April 1, 2024
181432
Lithuania
LTU
true
2
1
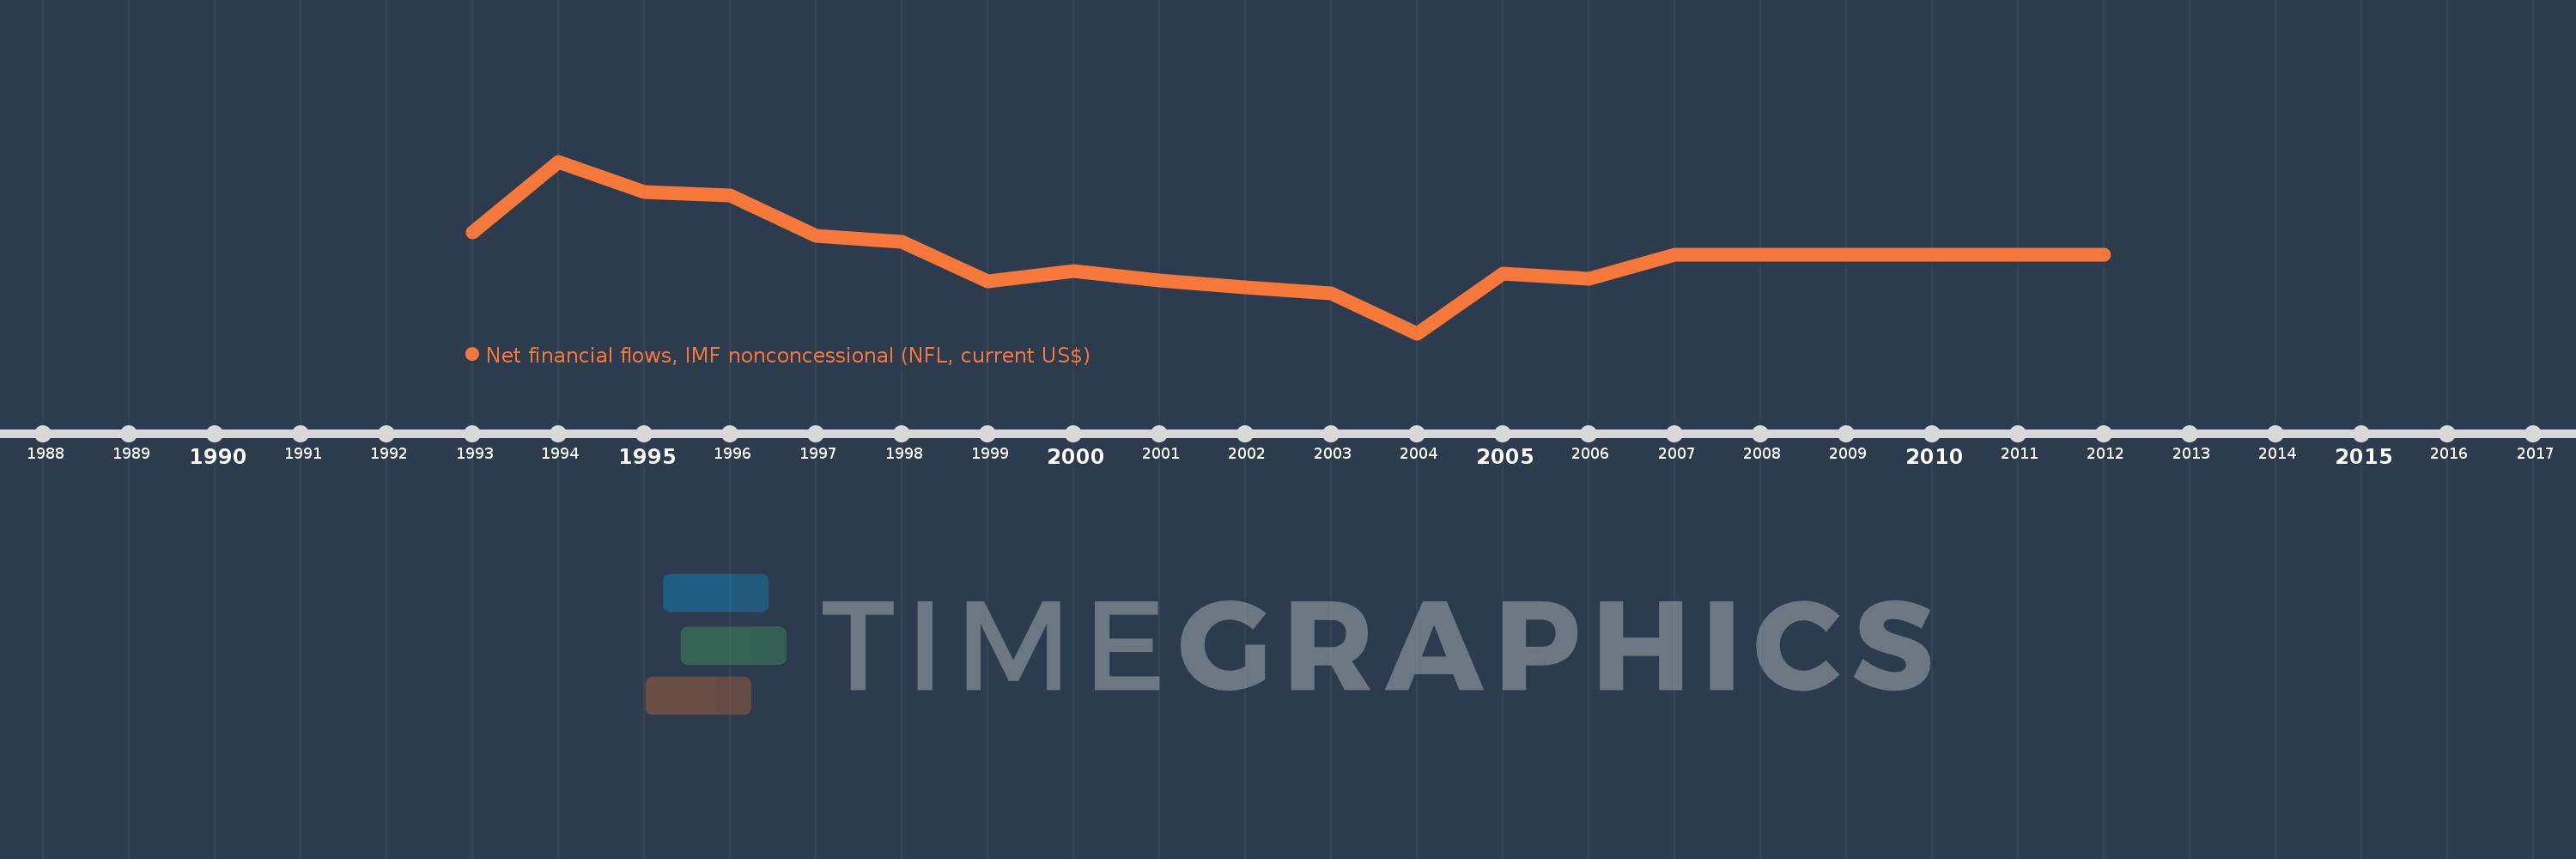
Net financial flows, IMF nonconcessional (NFL, current US$)
2012,2011,2010,2009,2008,2007,2006,2005,2004,2003,2002,2001,2000,1999,1998,1997,1996,1995,1994,1993
This statistics in other country:
Timeline:
This timeline shows a graph from 1993 to 2012 of Lithuania. No data until 1992. Number of actual observations by date: 20.
Source name:
World Development Indicators
Source organization:
World Bank, International Debt Statistics.
Categories, topics:
External Debt
Last updated:
apr 23, 2017
Indicators value changes by year
Minimum:
-82.643 mln
jan 1, 2004
Maximum:
98.76 mln
jan 1, 1994
At the date of observation
Value
Absolute change
Change from previous value
jan 1, 1993
24.299 mln
+24.299 mln
0.0%
jan 1, 1994
98.76 mln
+74.461 mln
306.44%
jan 1, 1995
66.698 mln
-32.062 mln
-32.46%
jan 1, 1996
62.814 mln
-3.884 mln
-5.82%
jan 1, 1997
20.556 mln
-42.258 mln
-67.27%
jan 1, 1998
14.242 mln
-6.314 mln
-30.72%
jan 1, 1999
-27.988 mln
-42.23 mln
-296.52%
jan 1, 2000
-16.511 mln
+11.477 mln
-41.01%
jan 1, 2001
-27.303 mln
-10.792 mln
65.36%
jan 1, 2002
-34.04 mln
-6.737 mln
24.67%
jan 1, 2003
-40.206 mln
-6.166 mln
18.11%
jan 1, 2004
-82.643 mln
-42.437 mln
105.55%
jan 1, 2005
-19.813 mln
+62.83 mln
-76.03%
jan 1, 2006
-24.847 mln
-5.034 mln
25.41%
jan 1, 2007
0.0
+24.847 mln
-100.0%
Ranking of countries by current statistics by years


Comments: