29
/
en
AIzaSyAYiBZKx7MnpbEhh9jyipgxe19OcubqV5w
April 1, 2024
232510
Samoa
WSM
true
2
1
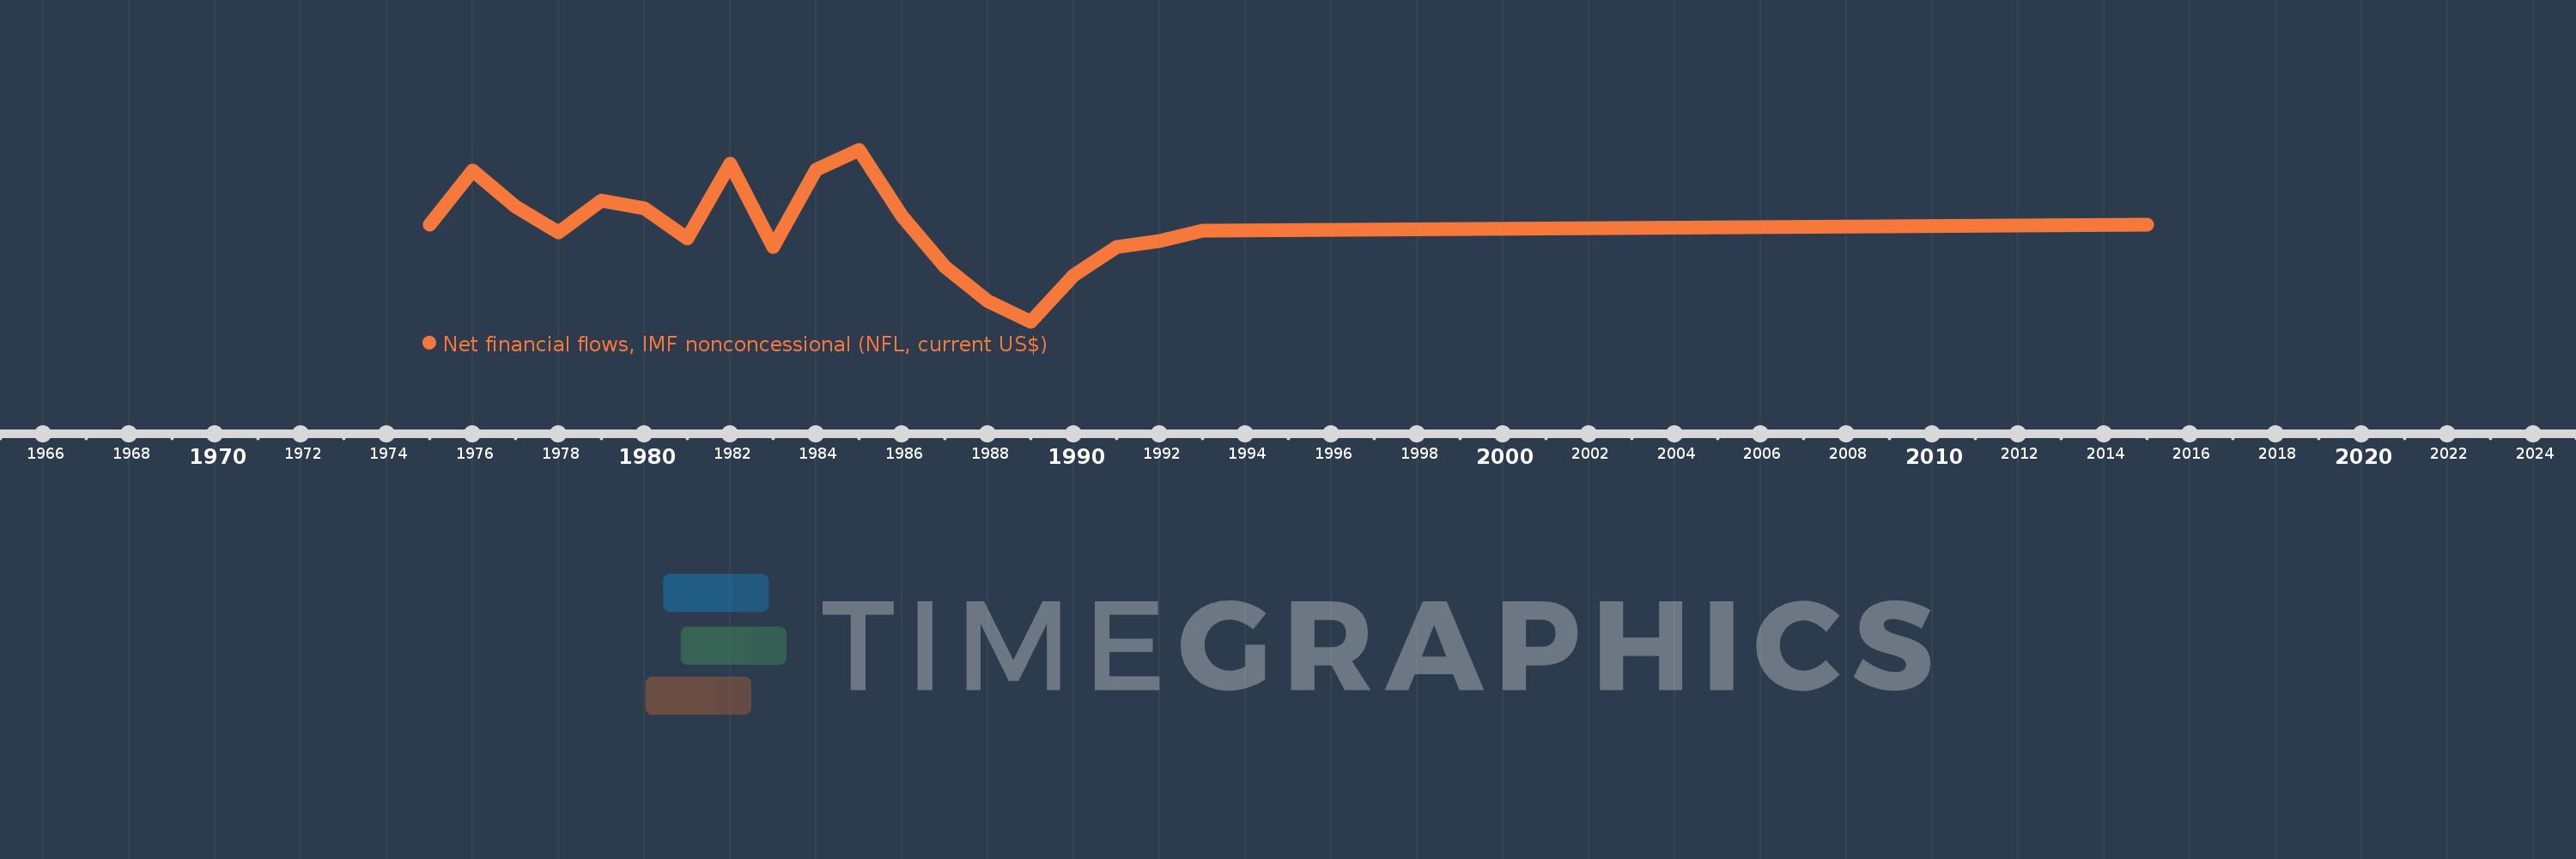
Net financial flows, IMF nonconcessional (NFL, current US$)
2015,1993,1992,1991,1990,1989,1988,1987,1986,1985,1984,1983,1982,1981,1980,1979,1978,1977,1976,1975
This statistics in other country:
Timeline:
This timeline shows a graph from 1975 to 2015 of Samoa. No data until 1974. Number of actual observations by date: 20.
Source name:
World Development Indicators
Source organization:
World Bank, International Debt Statistics.
Categories, topics:
External Debt
Last updated:
apr 23, 2017
Indicators value changes by year
Minimum:
-3.506 mln
jan 1, 1989
Maximum:
2.7 mln
jan 1, 1985
At the date of observation
Value
Absolute change
Change from previous value
jan 1, 1976
1.967 mln
+1.967 mln
%
jan 1, 1977
660.0K
-1.307 mln
-66.45%
jan 1, 1978
-280.0K
-940.0K
-142.42%
jan 1, 1979
874.0K
+1.154 mln
-412.14%
jan 1, 1980
610.0K
-264.0K
-30.21%
jan 1, 1981
-500.0K
-1.11 mln
-181.97%
jan 1, 1982
2.2 mln
+2.7 mln
-540.0%
jan 1, 1983
-800.0K
-3.0 mln
-136.36%
jan 1, 1984
2.0 mln
+2.8 mln
-350.0%
jan 1, 1985
2.7 mln
+700.0K
35.0%
jan 1, 1986
320.0K
-2.38 mln
-88.15%
jan 1, 1987
-1.51 mln
-1.83 mln
-571.88%
jan 1, 1988
-2.757 mln
-1.247 mln
82.58%
jan 1, 1989
-3.506 mln
-749.0K
27.17%
jan 1, 1990
-1.824 mln
+1.682 mln
-47.97%
jan 1, 1991
-787.0K
+1.037 mln
-56.85%
jan 1, 1992
-578.0K
+209.0K
-26.56%
jan 1, 1993
-223.0K
+355.0K
-61.42%
jan 1, 2015
0.0
+223.0K
-100.0%
Ranking of countries by current statistics by years


Comments: