29
/
en
AIzaSyAYiBZKx7MnpbEhh9jyipgxe19OcubqV5w
April 1, 2024
96474
Burundi
BDI
true
2
1
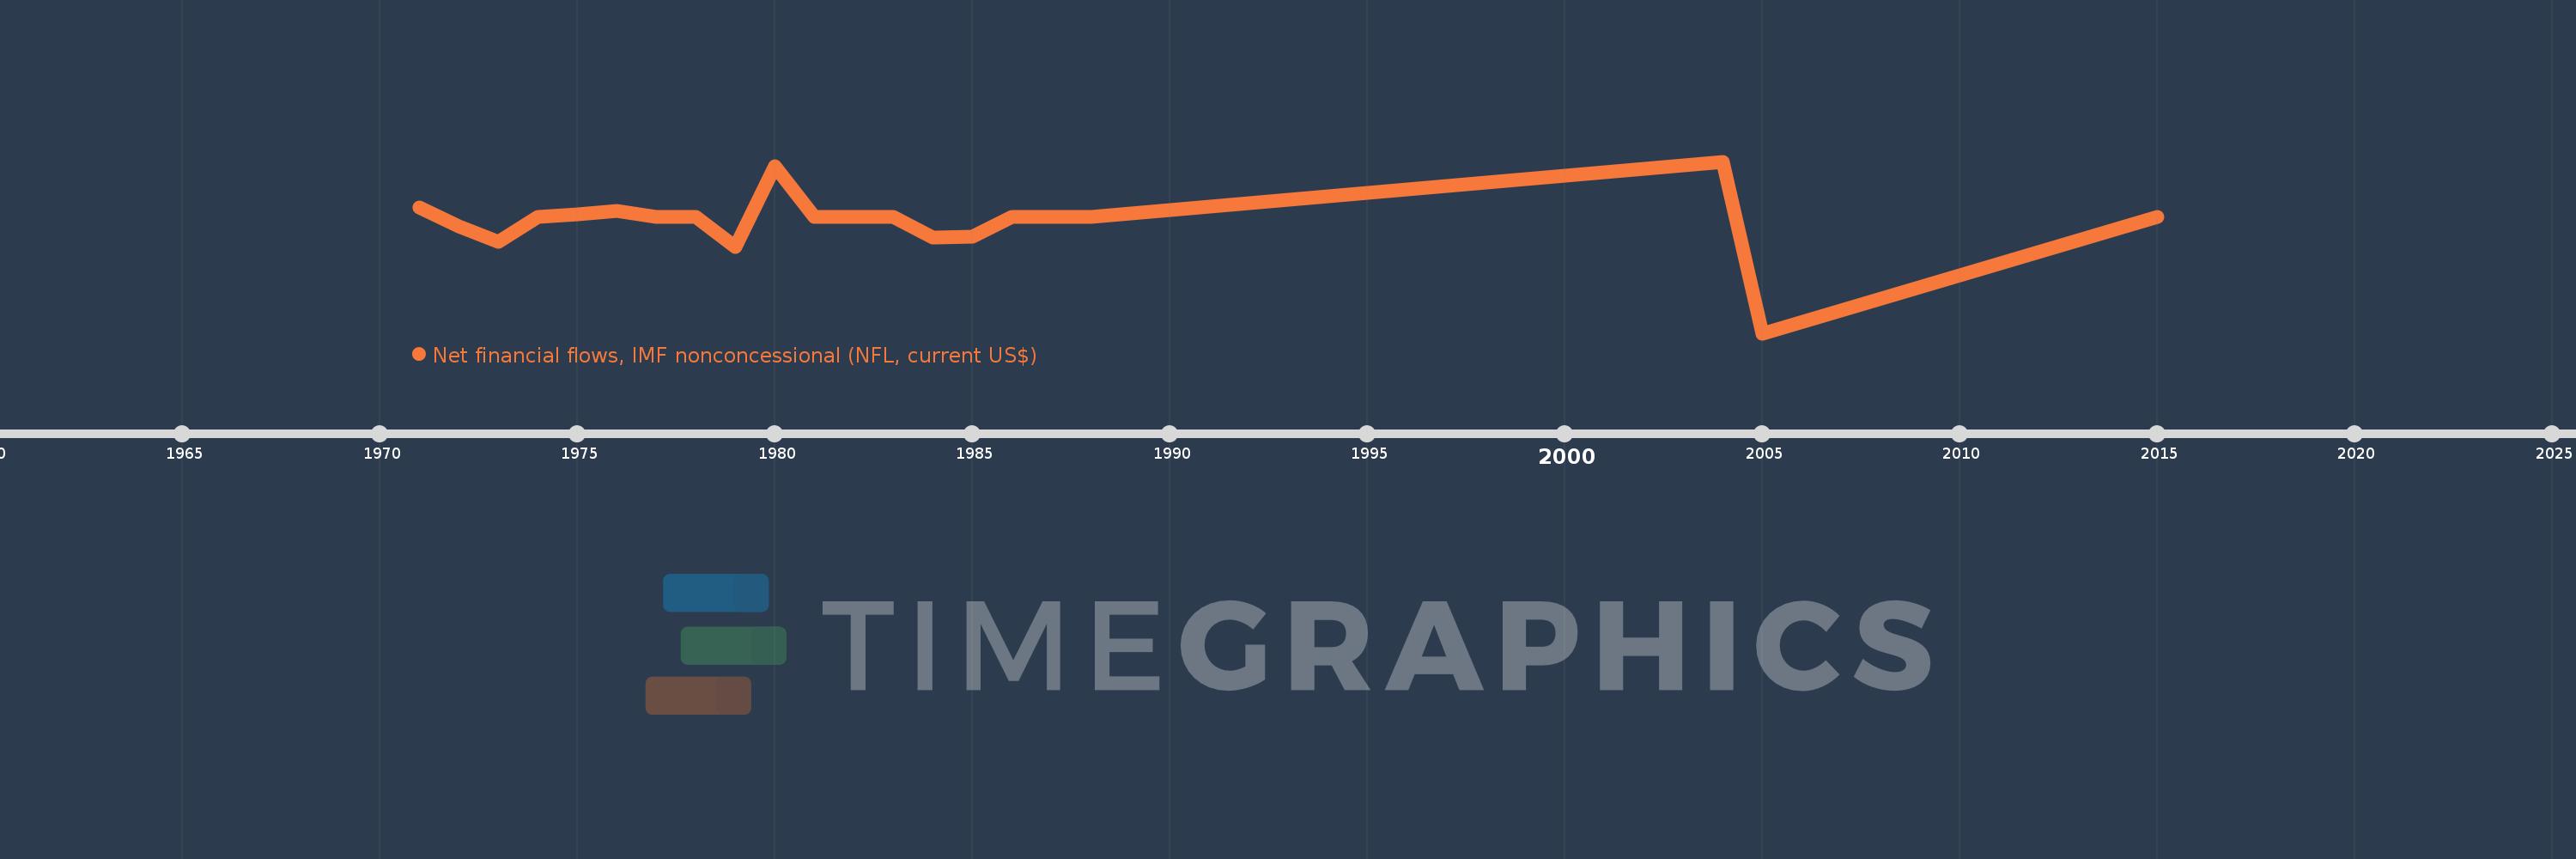
Net financial flows, IMF nonconcessional (NFL, current US$)
2015,2005,2004,2003,1988,1987,1986,1985,1984,1983,1982,1981,1980,1979,1978,1977,1976,1975,1974,1973,1972,1971
This statistics in other country:
Timeline:
This timeline shows a graph from 1971 to 2015 of Burundi. No data until 1970. Number of actual observations by date: 22.
Source name:
World Development Indicators
Source organization:
World Bank, International Debt Statistics.
Categories, topics:
External Debt
Last updated:
apr 23, 2017
Indicators value changes by year
Minimum:
-28.529 mln
jan 1, 2005
Maximum:
13.463 mln
jan 1, 2004
At the date of observation
Value
Absolute change
Change from previous value
jan 1, 1971
2.31 mln
+2.31 mln
0.0%
jan 1, 1972
-2.317 mln
-4.627 mln
-200.3%
jan 1, 1973
-6.102 mln
-3.785 mln
163.36%
jan 1, 1974
-143.0K
+5.959 mln
-97.66%
jan 1, 1975
469.0K
+612.0K
-427.97%
jan 1, 1976
1.457 mln
+988.0K
210.66%
jan 1, 1977
0.0
-1.457 mln
-100.0%
jan 1, 1979
-7.489 mln
-7.489 mln
%
jan 1, 1980
12.274 mln
+19.763 mln
-263.89%
jan 1, 1981
0.0
-12.274 mln
-100.0%
jan 1, 1984
-5.1 mln
-5.1 mln
%
jan 1, 1985
-4.9 mln
+200.0K
-3.92%
jan 1, 1986
0.0
+4.9 mln
-100.0%
jan 1, 2003
12.463 mln
+12.463 mln
%
jan 1, 2004
13.463 mln
+1000.0K
8.02%
jan 1, 2005
-28.529 mln
-41.992 mln
-311.91%
jan 1, 2015
0.0
+28.529 mln
-100.0%
Ranking of countries by current statistics by years


Comments: