29
/
en
AIzaSyAYiBZKx7MnpbEhh9jyipgxe19OcubqV5w
April 1, 2024
132331
Fiji
FJI
true
2
1
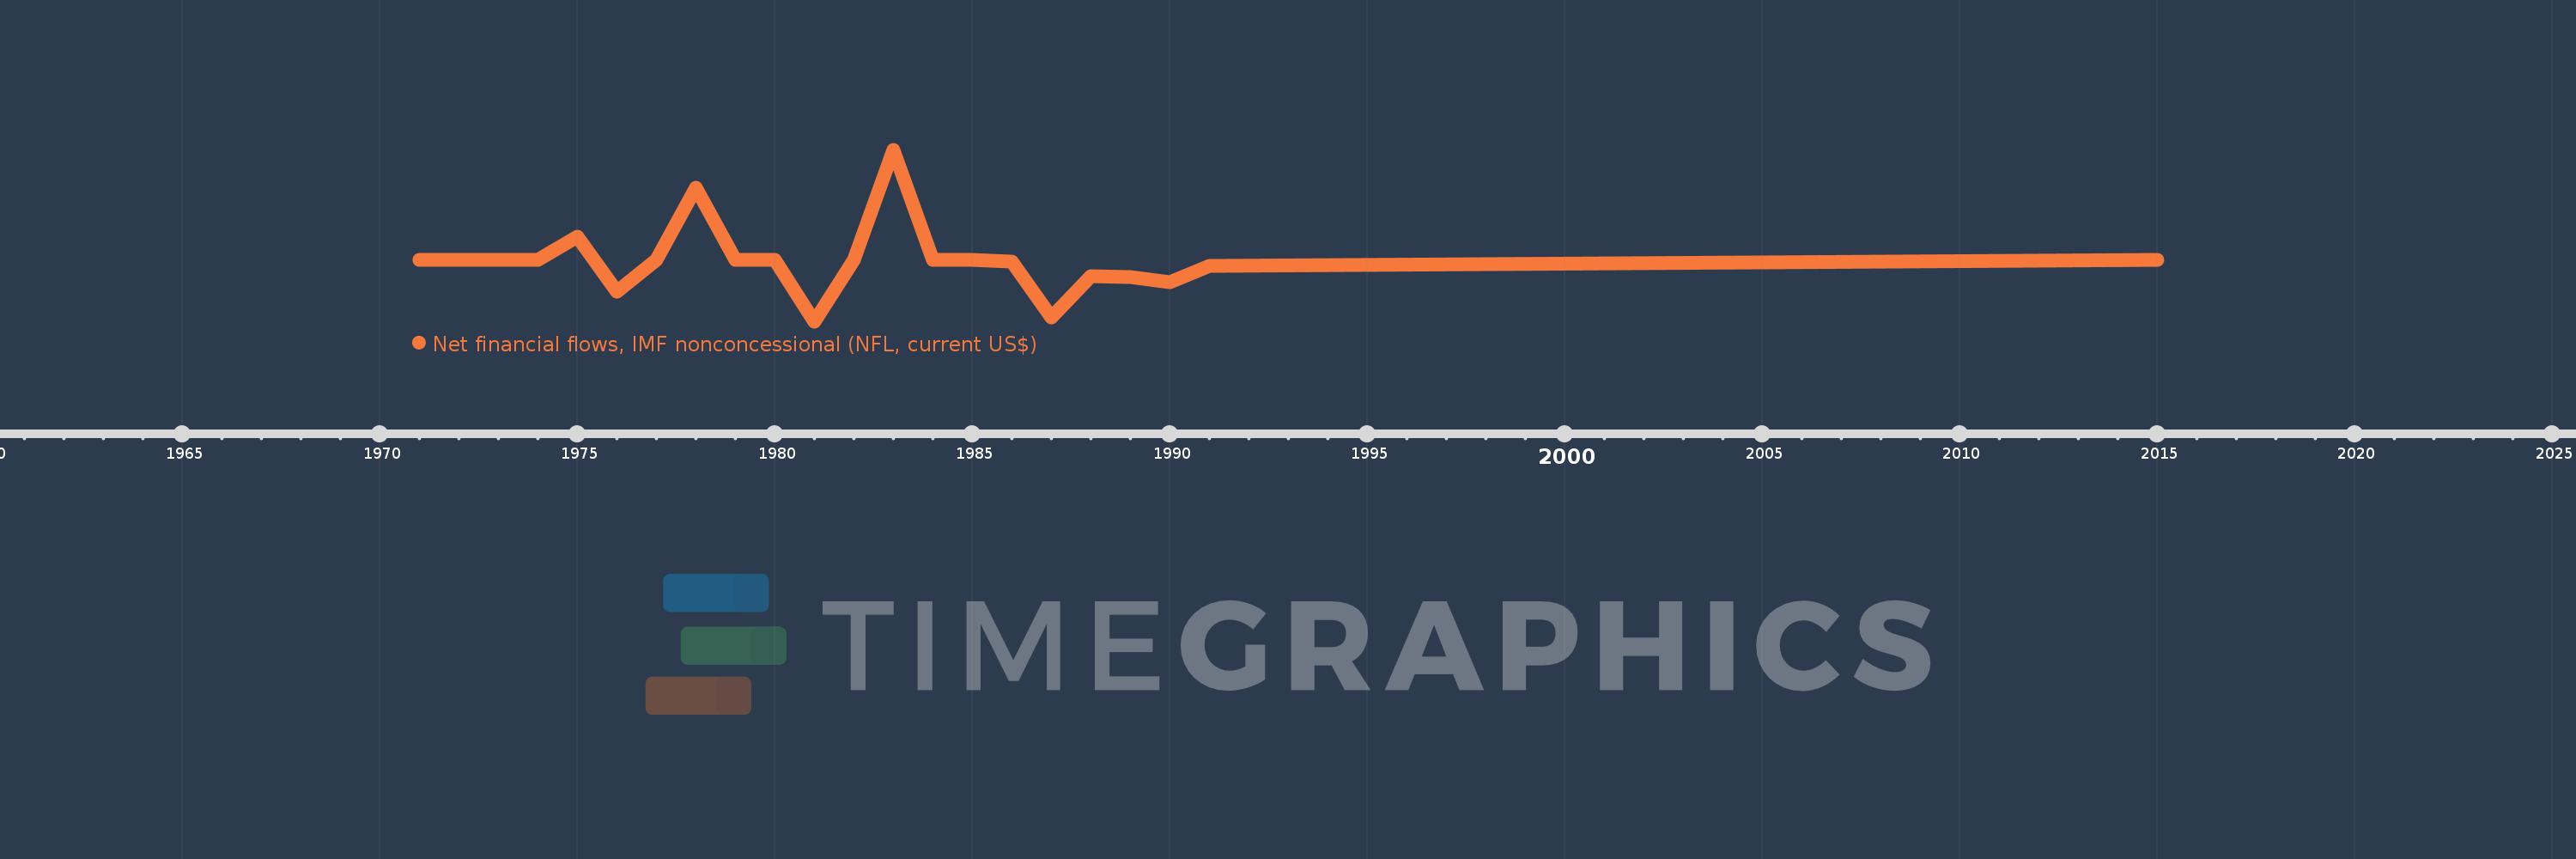
Net financial flows, IMF nonconcessional (NFL, current US$)
2015,1991,1990,1989,1988,1987,1986,1985,1984,1983,1982,1981,1980,1979,1978,1977,1976,1975,1974,1973,1972,1971
This statistics in other country:
Timeline:
This timeline shows a graph from 1971 to 2015 of Fiji. No data until 1970. Number of actual observations by date: 22.
Source name:
World Development Indicators
Source organization:
World Bank, International Debt Statistics.
Categories, topics:
External Debt
Last updated:
apr 23, 2017
Indicators value changes by year
Minimum:
-8.5 mln
jan 1, 1981
Maximum:
14.9 mln
jan 1, 1983
At the date of observation
Value
Absolute change
Change from previous value
jan 1, 1975
3.175 mln
+3.175 mln
%
jan 1, 1976
-4.36 mln
-7.535 mln
-237.32%
jan 1, 1977
0.0
+4.36 mln
-100.0%
jan 1, 1978
9.823 mln
+9.823 mln
%
jan 1, 1979
0.0
-9.823 mln
-100.0%
jan 1, 1981
-8.5 mln
-8.5 mln
%
jan 1, 1982
0.0
+8.5 mln
-100.0%
jan 1, 1983
14.9 mln
+14.9 mln
%
jan 1, 1984
0.0
-14.9 mln
-100.0%
jan 1, 1986
-320.0K
-320.0K
%
jan 1, 1987
-7.92 mln
-7.6 mln
2.38K%
jan 1, 1988
-2.211 mln
+5.709 mln
-72.08%
jan 1, 1989
-2.394 mln
-183.0K
8.28%
jan 1, 1990
-3.045 mln
-651.0K
27.19%
jan 1, 1991
-806.0K
+2.239 mln
-73.53%
jan 1, 2015
0.0
+806.0K
-100.0%
Ranking of countries by current statistics by years


Comments: