29
/
en
AIzaSyAYiBZKx7MnpbEhh9jyipgxe19OcubqV5w
April 1, 2024
81631
Belgium
BEL
true
2
1
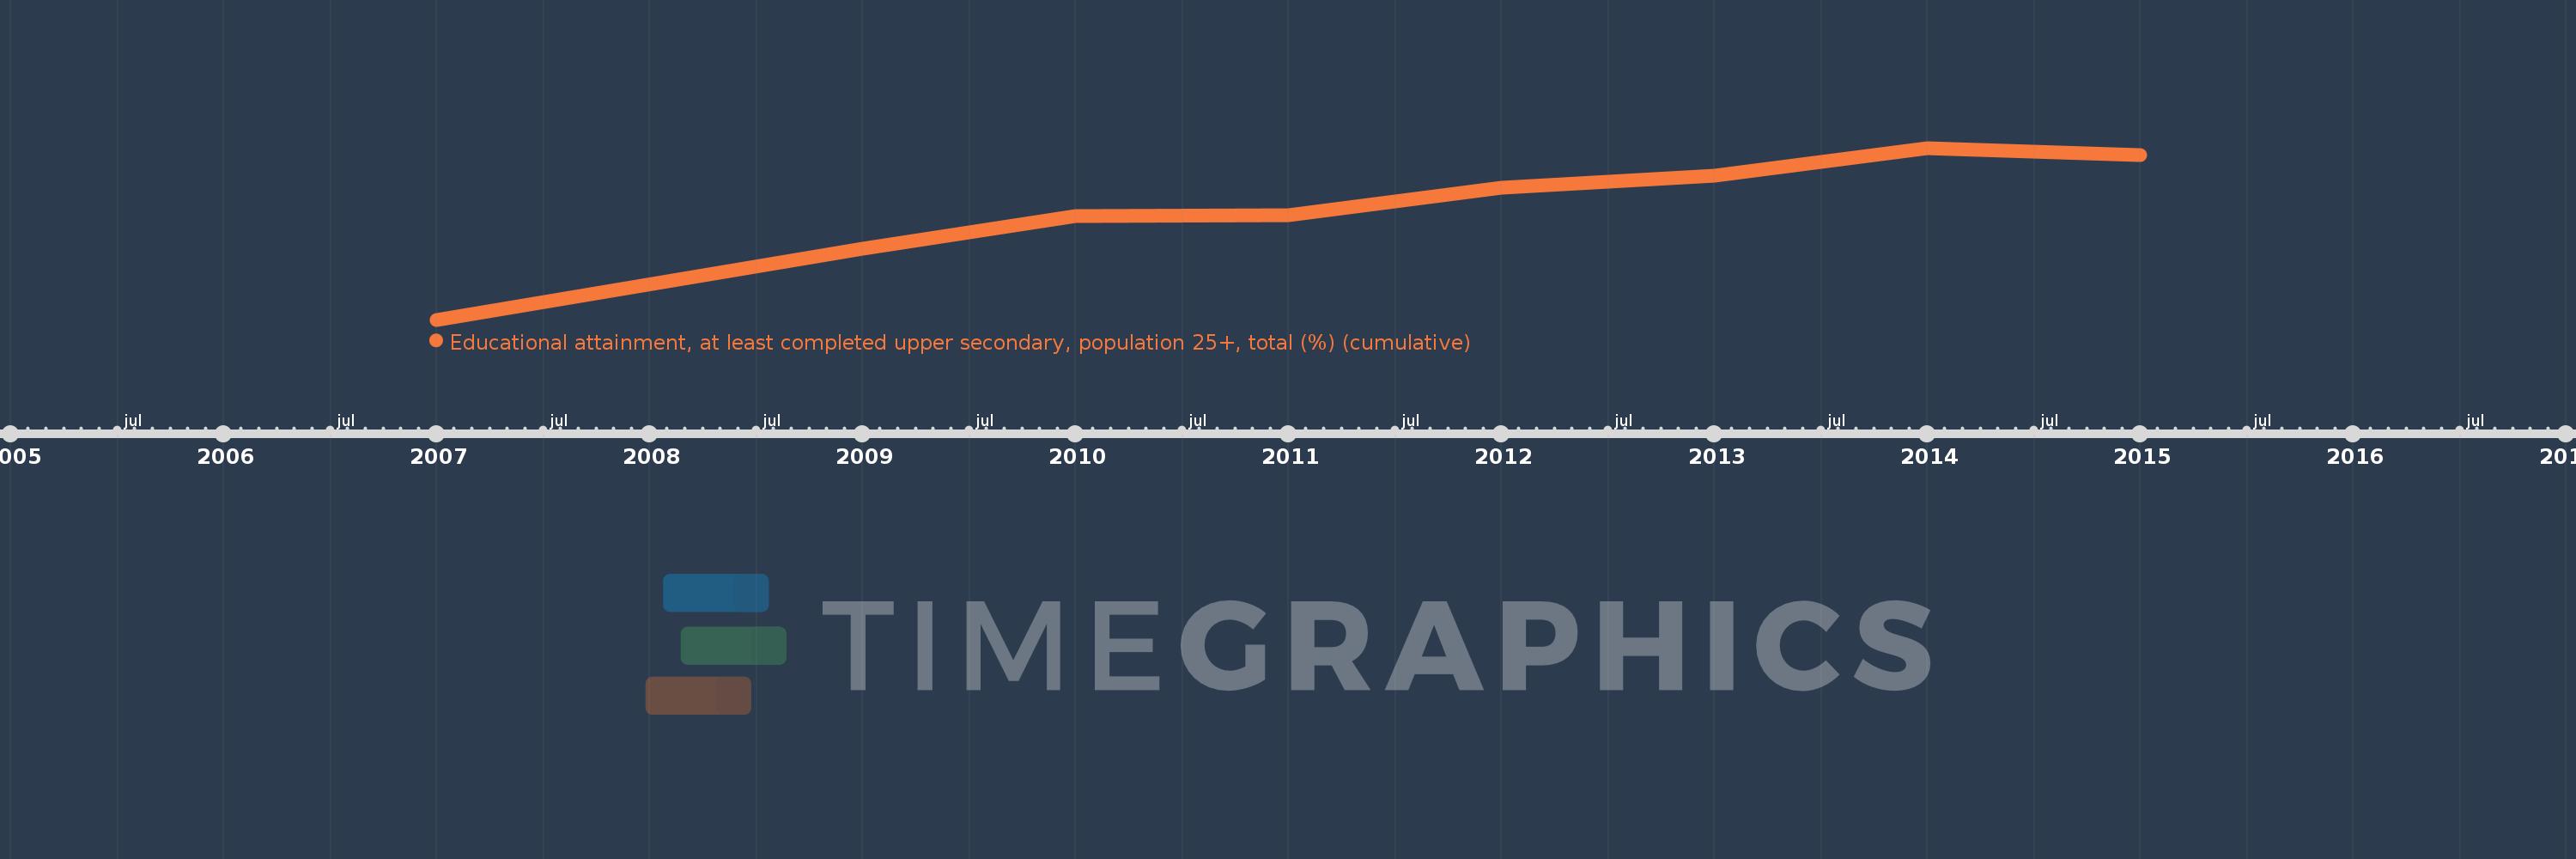
Educational attainment, at least completed upper secondary, population 25+, total (%) (cumulative)
2015,2014,2013,2012,2011,2010,2009,2007
This statistics in other country:
Timeline:
This timeline shows a graph from 2007 to 2015 of Belgium. No data until 2006. Number of actual observations by date: 8.
Source name:
World Development Indicators
Source organization:
United Nations Educational, Scientific, and Cultural Organization (UNESCO) Institute for Statistics.
Categories, topics:
Education, Gender
Last updated:
apr 23, 2017
Indicators value changes by year
Minimum:
57.733
jan 1, 2007
Maximum:
64.279
jan 1, 2014
At the date of observation
Value
Absolute change
Change from previous value
jan 1, 2007
57.733
+57.733
0.0%
jan 1, 2009
60.424
+2.691
4.66%
jan 1, 2010
61.693
+1.269
2.1%
jan 1, 2011
61.728
+0.035
0.06%
jan 1, 2012
62.76
+1.032
1.67%
jan 1, 2013
63.211
+0.451
0.72%
jan 1, 2014
64.279
+1.068
1.69%
jan 1, 2015
64.019
-0.26
-0.4%
Ranking of countries by current statistics by years


Comments: