29
/
en
AIzaSyAYiBZKx7MnpbEhh9jyipgxe19OcubqV5w
April 1, 2024
276532
United States
USA
true
2
1
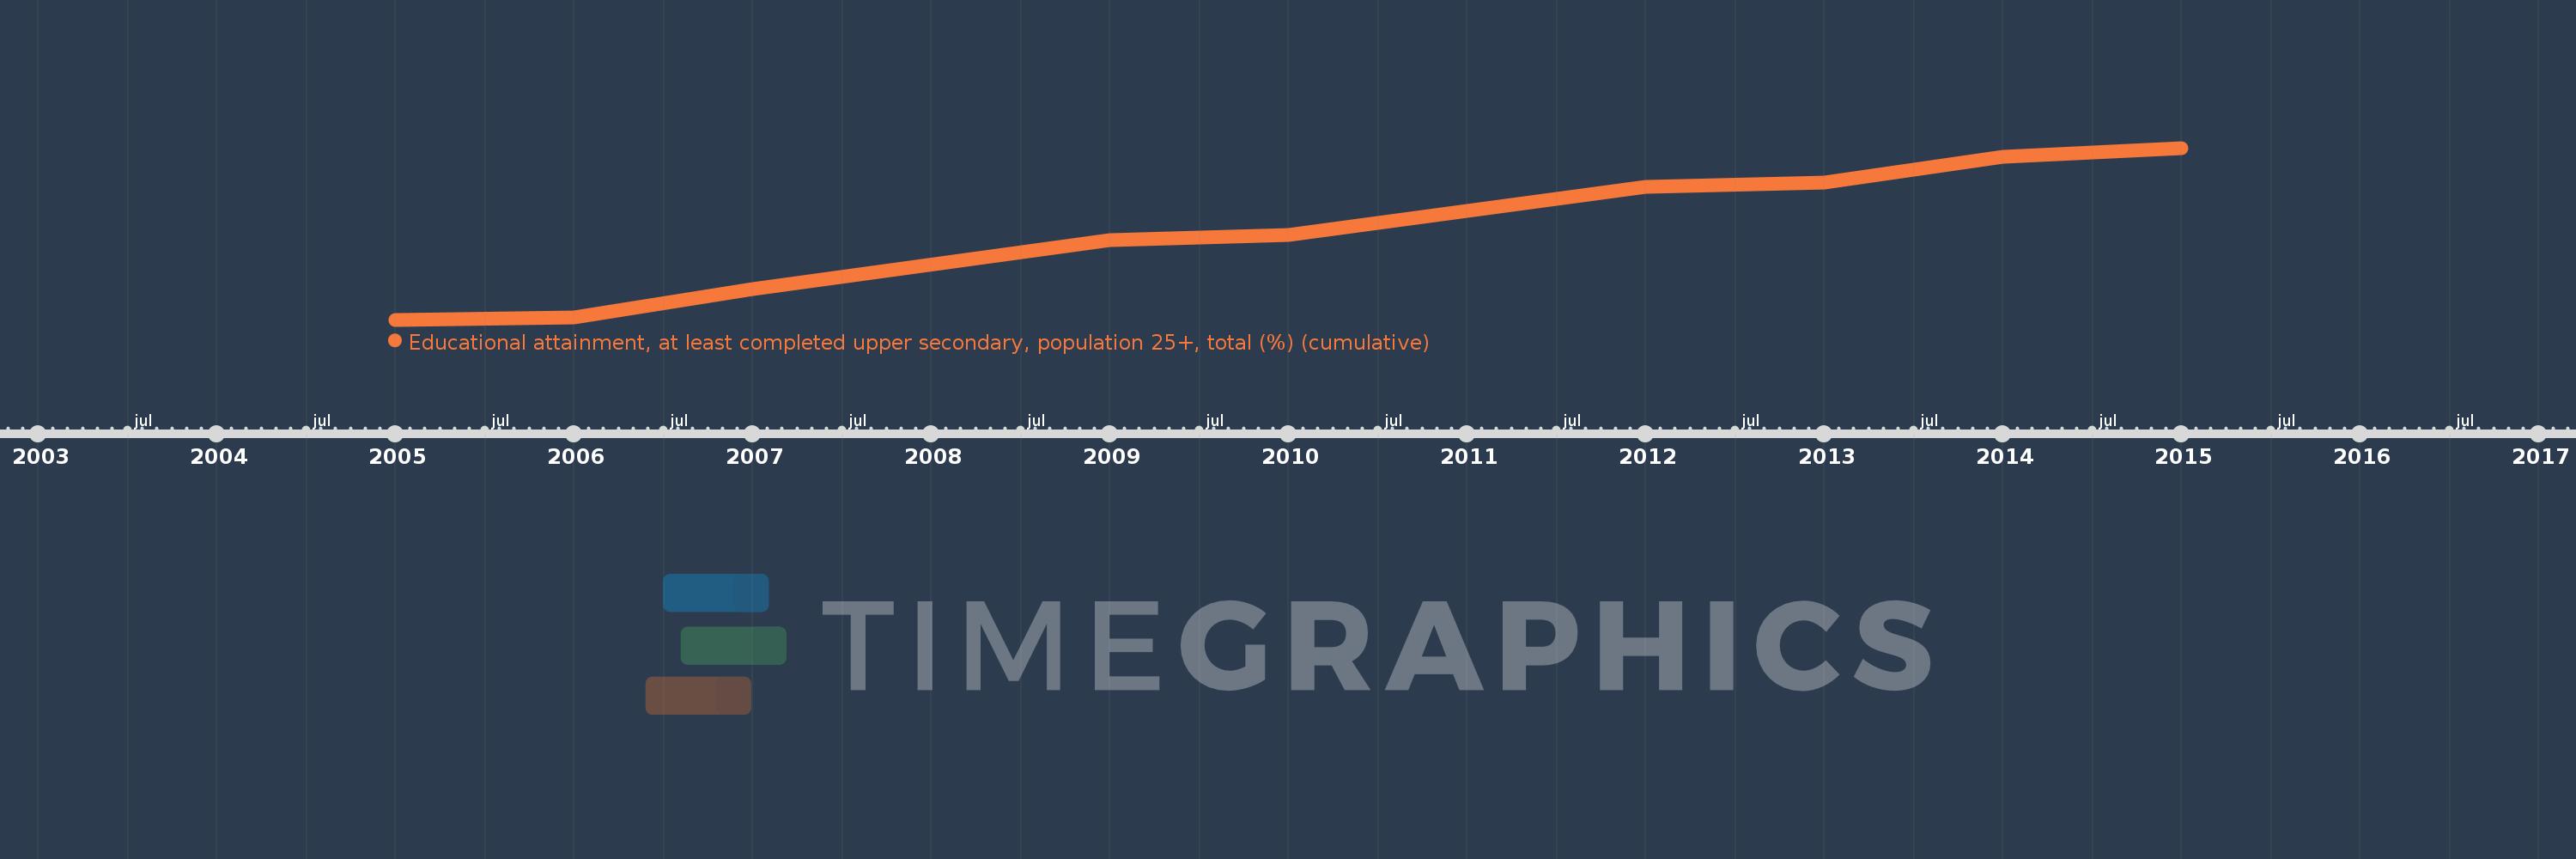
Educational attainment, at least completed upper secondary, population 25+, total (%) (cumulative)
2015,2014,2013,2012,2011,2010,2009,2007,2006,2005
This statistics in other country:
Timeline:
This timeline shows a graph from 2005 to 2015 of United States. No data until 2004. Number of actual observations by date: 10.
Source name:
World Development Indicators
Source organization:
United Nations Educational, Scientific, and Cultural Organization (UNESCO) Institute for Statistics.
Categories, topics:
Education, Gender
Last updated:
apr 23, 2017
Indicators value changes by year
Minimum:
85.153
jan 1, 2005
Maximum:
88.314
jan 1, 2015
At the date of observation
Value
Absolute change
Change from previous value
jan 1, 2005
85.153
+85.153
0.0%
jan 1, 2006
85.192
+0.039
0.05%
jan 1, 2007
85.723
+0.531
0.62%
jan 1, 2009
86.614
+0.891
1.04%
jan 1, 2010
86.709
+0.095
0.11%
jan 1, 2011
87.149
+0.44
0.51%
jan 1, 2012
87.591
+0.441
0.51%
jan 1, 2013
87.679
+0.088
0.1%
jan 1, 2014
88.15
+0.471
0.54%
jan 1, 2015
88.314
+0.163
0.19%
Ranking of countries by current statistics by years


Comments: