29
/
en
AIzaSyAYiBZKx7MnpbEhh9jyipgxe19OcubqV5w
April 1, 2024
222048
Peru
PER
true
2
1
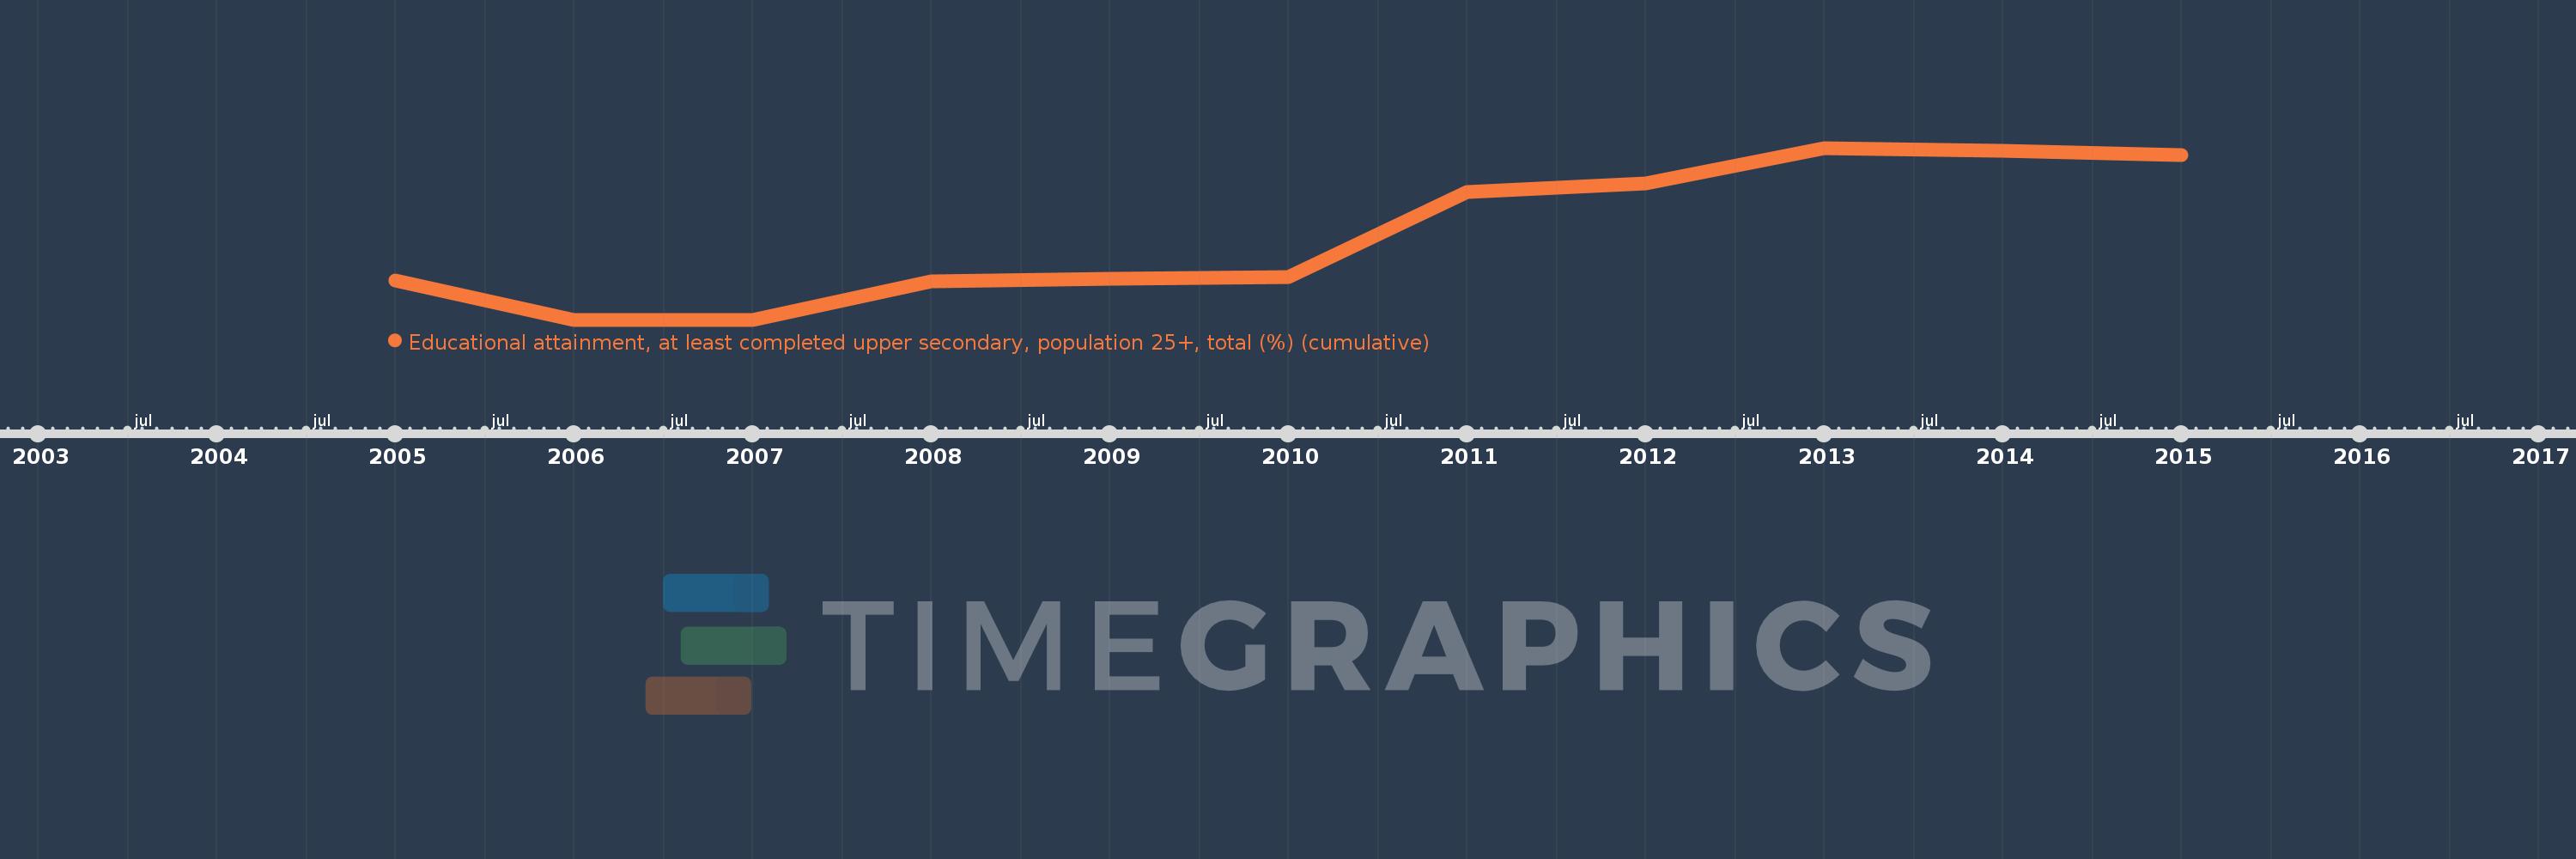
Educational attainment, at least completed upper secondary, population 25+, total (%) (cumulative)
2015,2014,2013,2012,2011,2010,2009,2008,2007,2006,2005
This statistics in other country:
Timeline:
This timeline shows a graph from 2005 to 2015 of Peru. No data until 2004. Number of actual observations by date: 11.
Source name:
World Development Indicators
Source organization:
United Nations Educational, Scientific, and Cultural Organization (UNESCO) Institute for Statistics.
Categories, topics:
Education, Gender
Last updated:
apr 23, 2017
Indicators value changes by year
Maximum:
55.992
jan 1, 2013
At the date of observation
Value
Absolute change
Change from previous value
jan 1, 2005
46.776
+46.776
0.0%
jan 1, 2006
44.04
-2.736
-5.85%
jan 1, 2007
44.051
+0.011
0.03%
jan 1, 2008
46.705
+2.654
6.03%
jan 1, 2009
46.866
+0.161
0.34%
jan 1, 2010
47.003
+0.137
0.29%
jan 1, 2011
52.939
+5.936
12.63%
jan 1, 2012
53.522
+0.583
1.1%
jan 1, 2013
55.992
+2.47
4.61%
jan 1, 2014
55.81
-0.182
-0.32%
jan 1, 2015
55.497
-0.313
-0.56%
Ranking of countries by current statistics by years


Comments: