29
/
en
AIzaSyAYiBZKx7MnpbEhh9jyipgxe19OcubqV5w
April 1, 2024
91013
Brazil
BRA
true
2
1
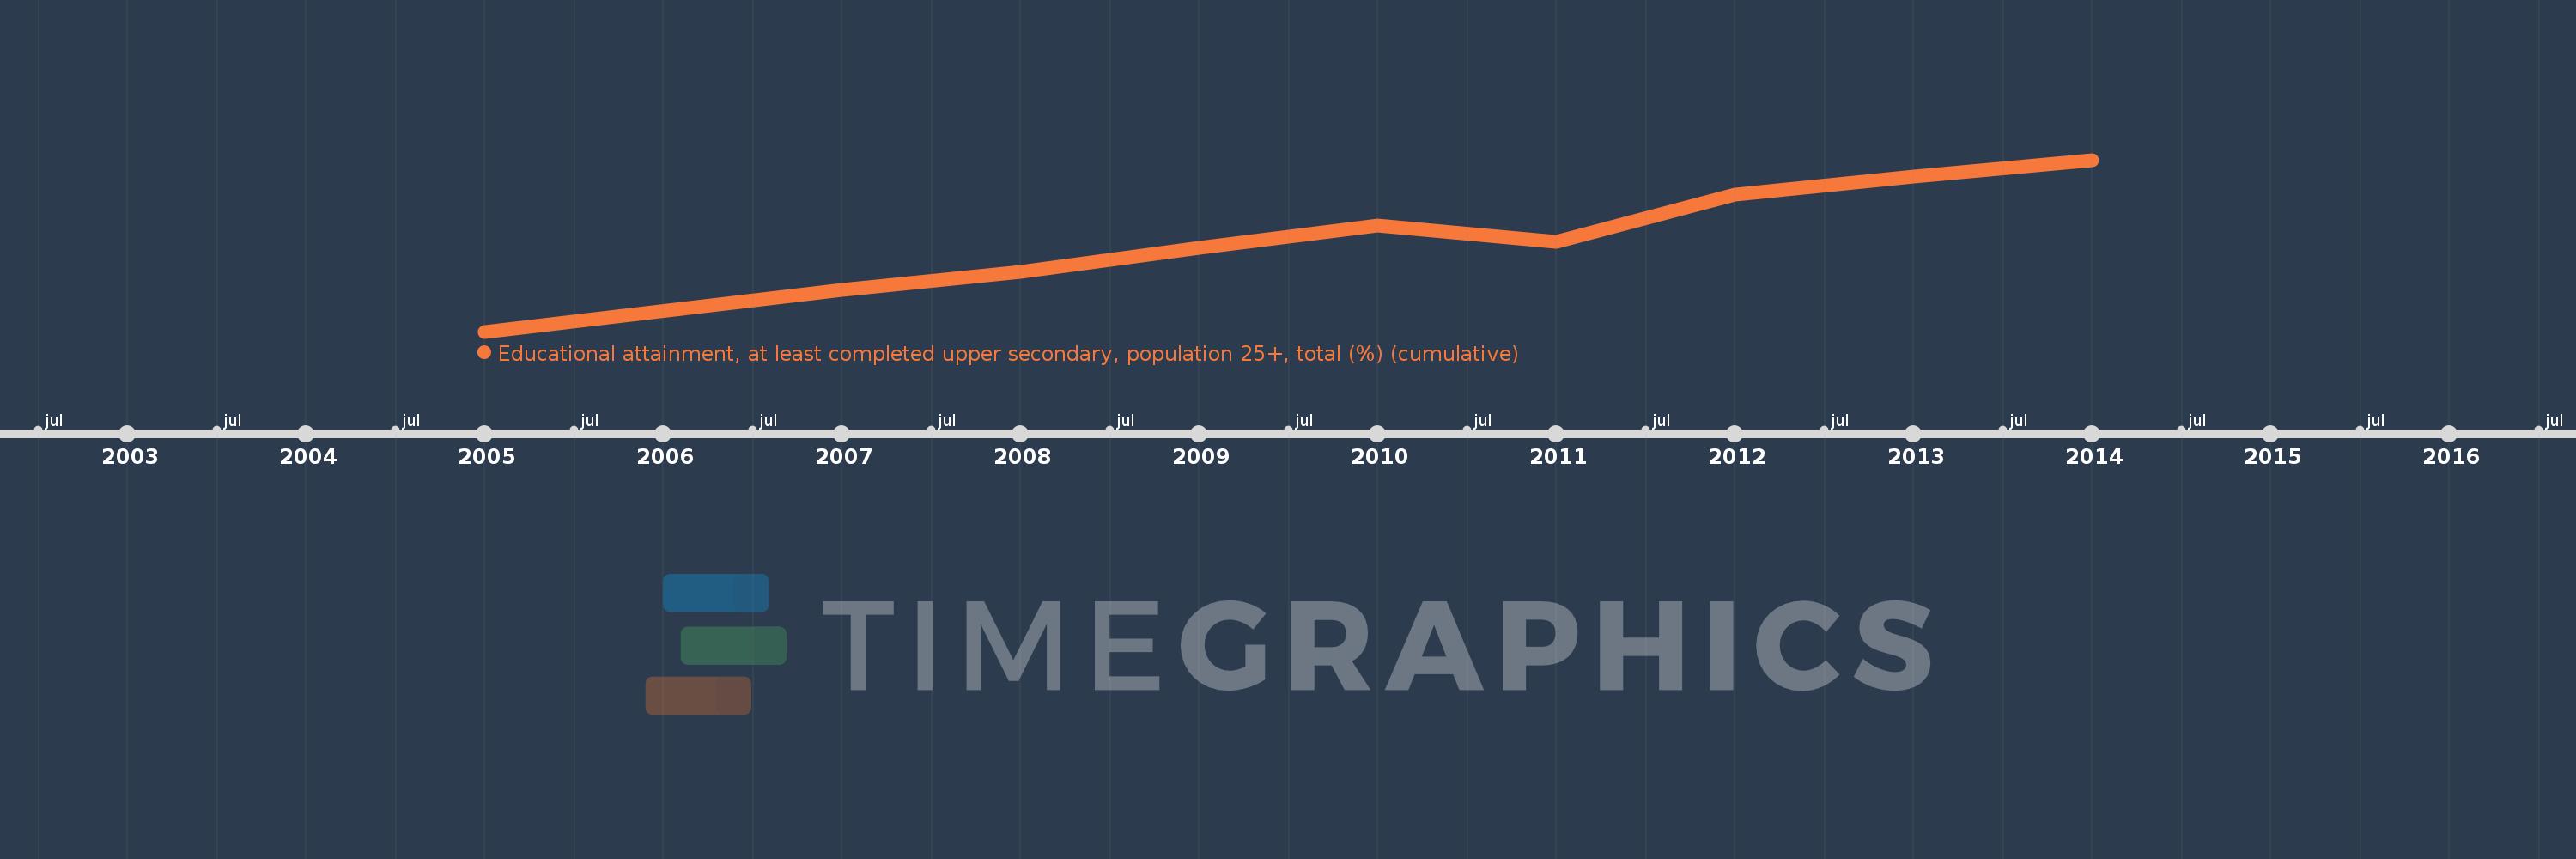
Educational attainment, at least completed upper secondary, population 25+, total (%) (cumulative)
2014,2013,2012,2011,2010,2009,2008,2007,2005
This statistics in other country:
Timeline:
This timeline shows a graph from 2005 to 2014 of Brazil. No data until 2004. Number of actual observations by date: 9.
Source name:
World Development Indicators
Source organization:
United Nations Educational, Scientific, and Cultural Organization (UNESCO) Institute for Statistics.
Categories, topics:
Education, Gender
Last updated:
apr 23, 2017
Indicators value changes by year
Minimum:
29.416
jan 1, 2005
Maximum:
41.854
jan 1, 2014
At the date of observation
Value
Absolute change
Change from previous value
jan 1, 2005
29.416
+29.416
0.0%
jan 1, 2007
32.421
+3.005
10.22%
jan 1, 2008
33.746
+1.324
4.09%
jan 1, 2009
35.454
+1.709
5.06%
jan 1, 2010
37.107
+1.652
4.66%
jan 1, 2011
35.923
-1.184
-3.19%
jan 1, 2012
39.361
+3.438
9.57%
jan 1, 2013
40.611
+1.25
3.18%
jan 1, 2014
41.854
+1.242
3.06%
Ranking of countries by current statistics by years


Comments: