29
/
en
AIzaSyAYiBZKx7MnpbEhh9jyipgxe19OcubqV5w
April 1, 2024
207822
Netherlands
NLD
true
2
1
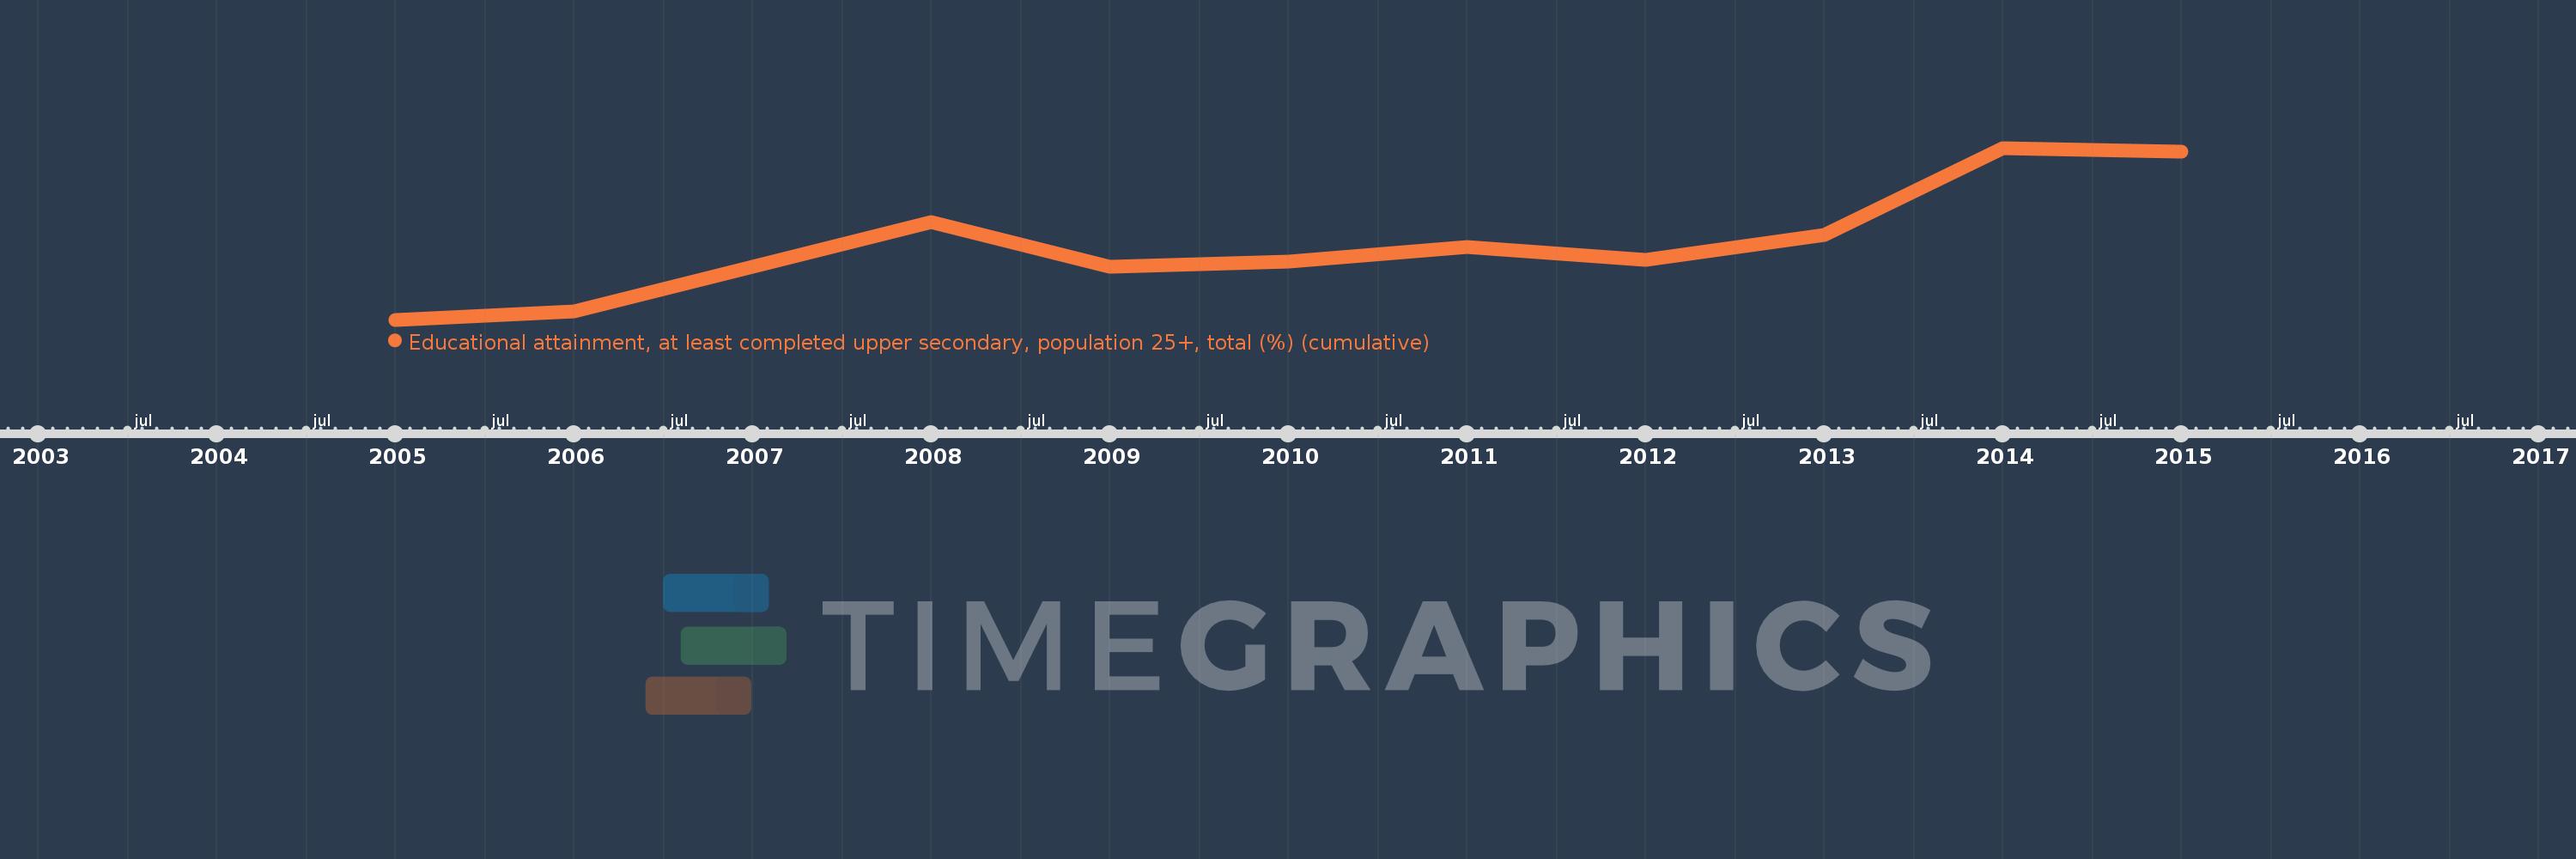
Educational attainment, at least completed upper secondary, population 25+, total (%) (cumulative)
2015,2014,2013,2012,2011,2010,2009,2008,2006,2005
This statistics in other country:
Timeline:
This timeline shows a graph from 2005 to 2015 of Netherlands. No data until 2004. Number of actual observations by date: 10.
Source name:
World Development Indicators
Source organization:
United Nations Educational, Scientific, and Cultural Organization (UNESCO) Institute for Statistics.
Categories, topics:
Education, Gender
Last updated:
apr 23, 2017
Indicators value changes by year
Minimum:
64.728
jan 1, 2005
At the date of observation
Value
Absolute change
Change from previous value
jan 1, 2005
64.728
+64.728
0.0%
jan 1, 2006
64.954
+0.226
0.35%
jan 1, 2008
67.449
+2.494
3.84%
jan 1, 2009
66.221
-1.228
-1.82%
jan 1, 2010
66.345
+0.123
0.19%
jan 1, 2011
66.772
+0.428
0.64%
jan 1, 2012
66.41
-0.363
-0.54%
jan 1, 2013
67.099
+0.689
1.04%
jan 1, 2014
69.53
+2.431
3.62%
jan 1, 2015
69.422
-0.107
-0.15%
Ranking of countries by current statistics by years


Comments: