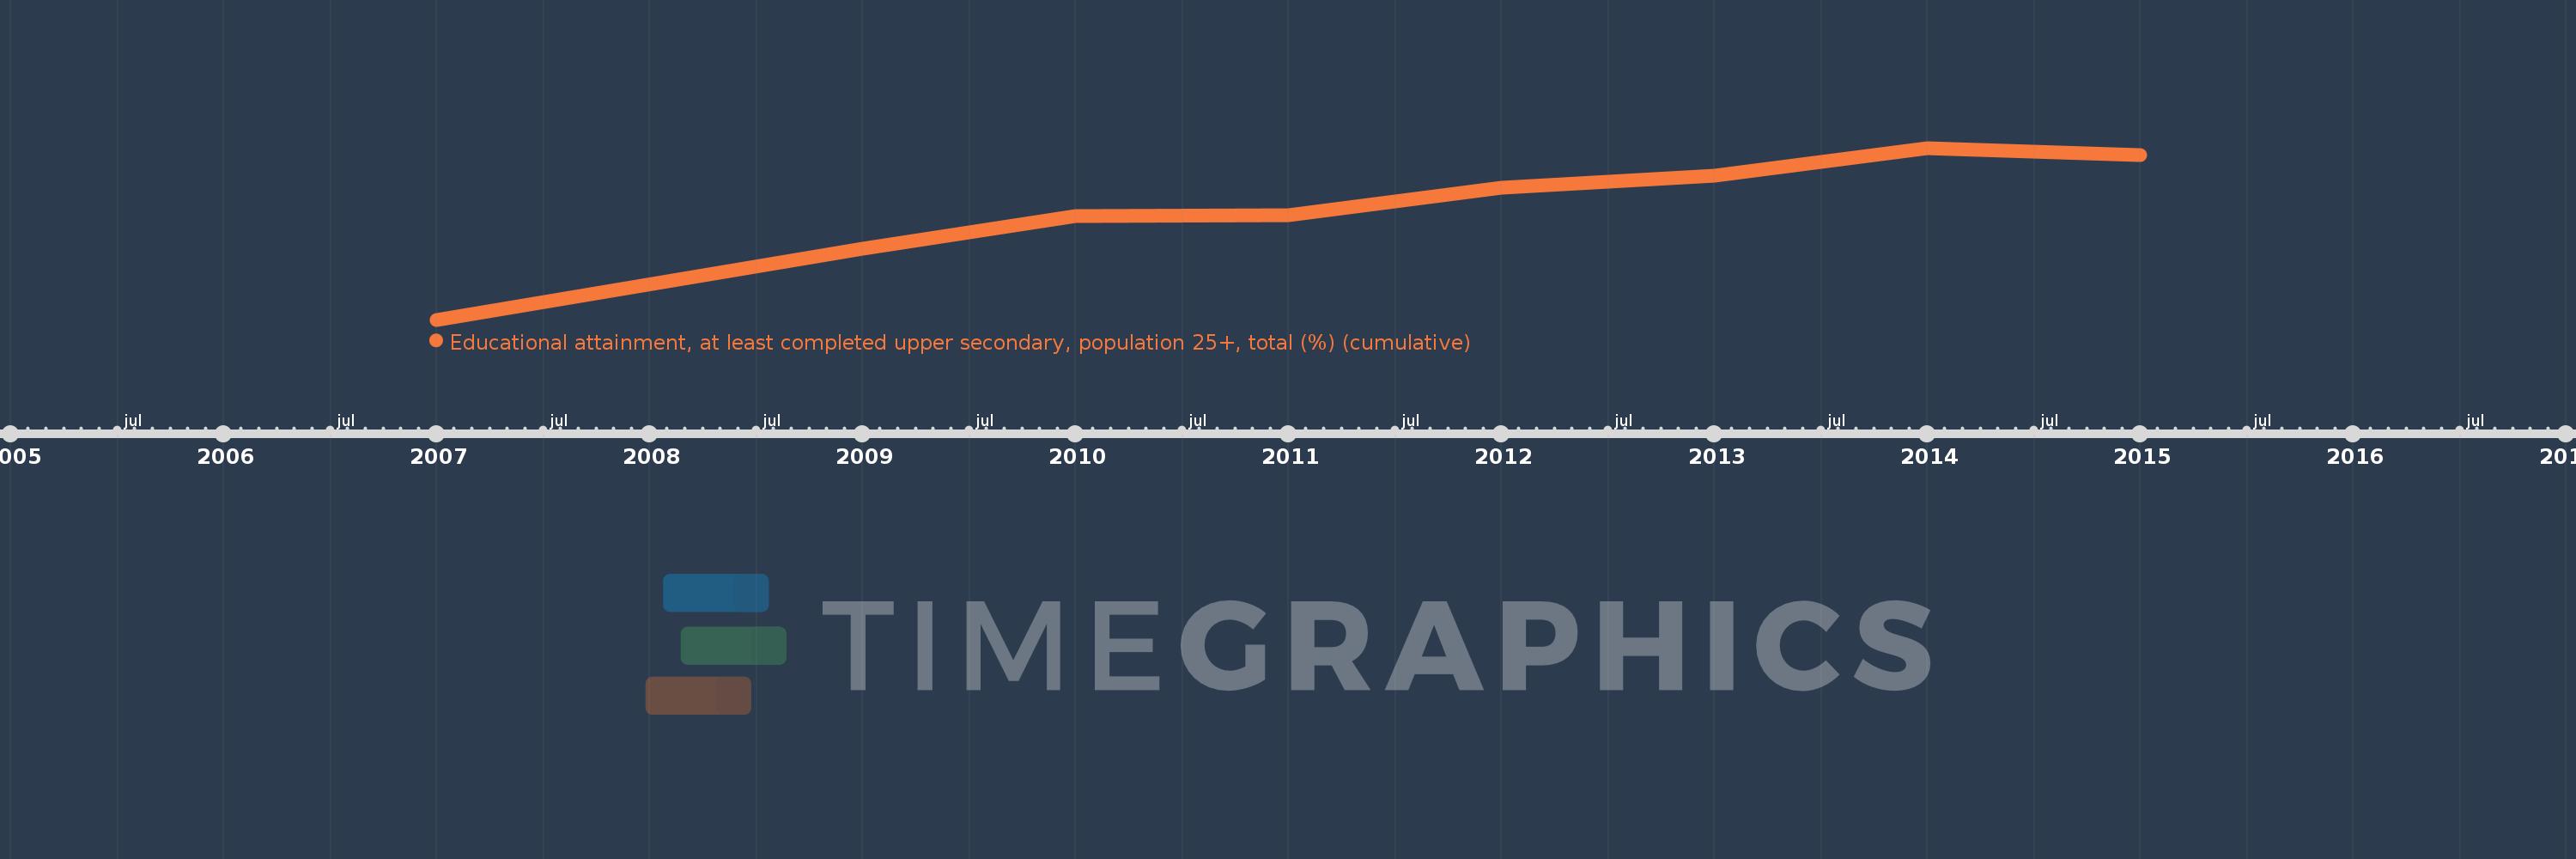
Questa scala temporale mostra un grafico dal 2007 anno al 2015 anno. Belgium. I dati fino ad 2006 anno non disponibili. Il numero di osservazioni attuali secondo i date: 8.
La fonte (nome):
Indicatori dello sviluppo mondiale
La fonte (organizzazione):
United Nations Educational, Scientific, and Cultural Organization (UNESCO) Institute for Statistics.
Categorie:
Education, Gender
sono stati aggiornati
23 apr 2017 anni
Indicatori delle variazioni dei valori per anni
In media:
61.981
Minima:
57.733
1 gen 2007 anni
Massimo:
64.279
1 gen 2014 anni
Alla data di osservazione
Valore
Variazione assoluta
La variazione rispetto al valore precedente
1 gen 2007 anni
57.733
+57.733
0.0%
1 gen 2009 anni
60.424
+2.691
4.66%
1 gen 2010 anni
61.693
+1.269
2.1%
1 gen 2011 anni
61.728
+0.035
0.06%
1 gen 2012 anni
62.76
+1.032
1.67%
1 gen 2013 anni
63.211
+0.451
0.72%
1 gen 2014 anni
64.279
+1.068
1.69%
1 gen 2015 anni
64.019
-0.26
-0.4%
Classificazione dei paesi secondo i statistiche attuali per anni
