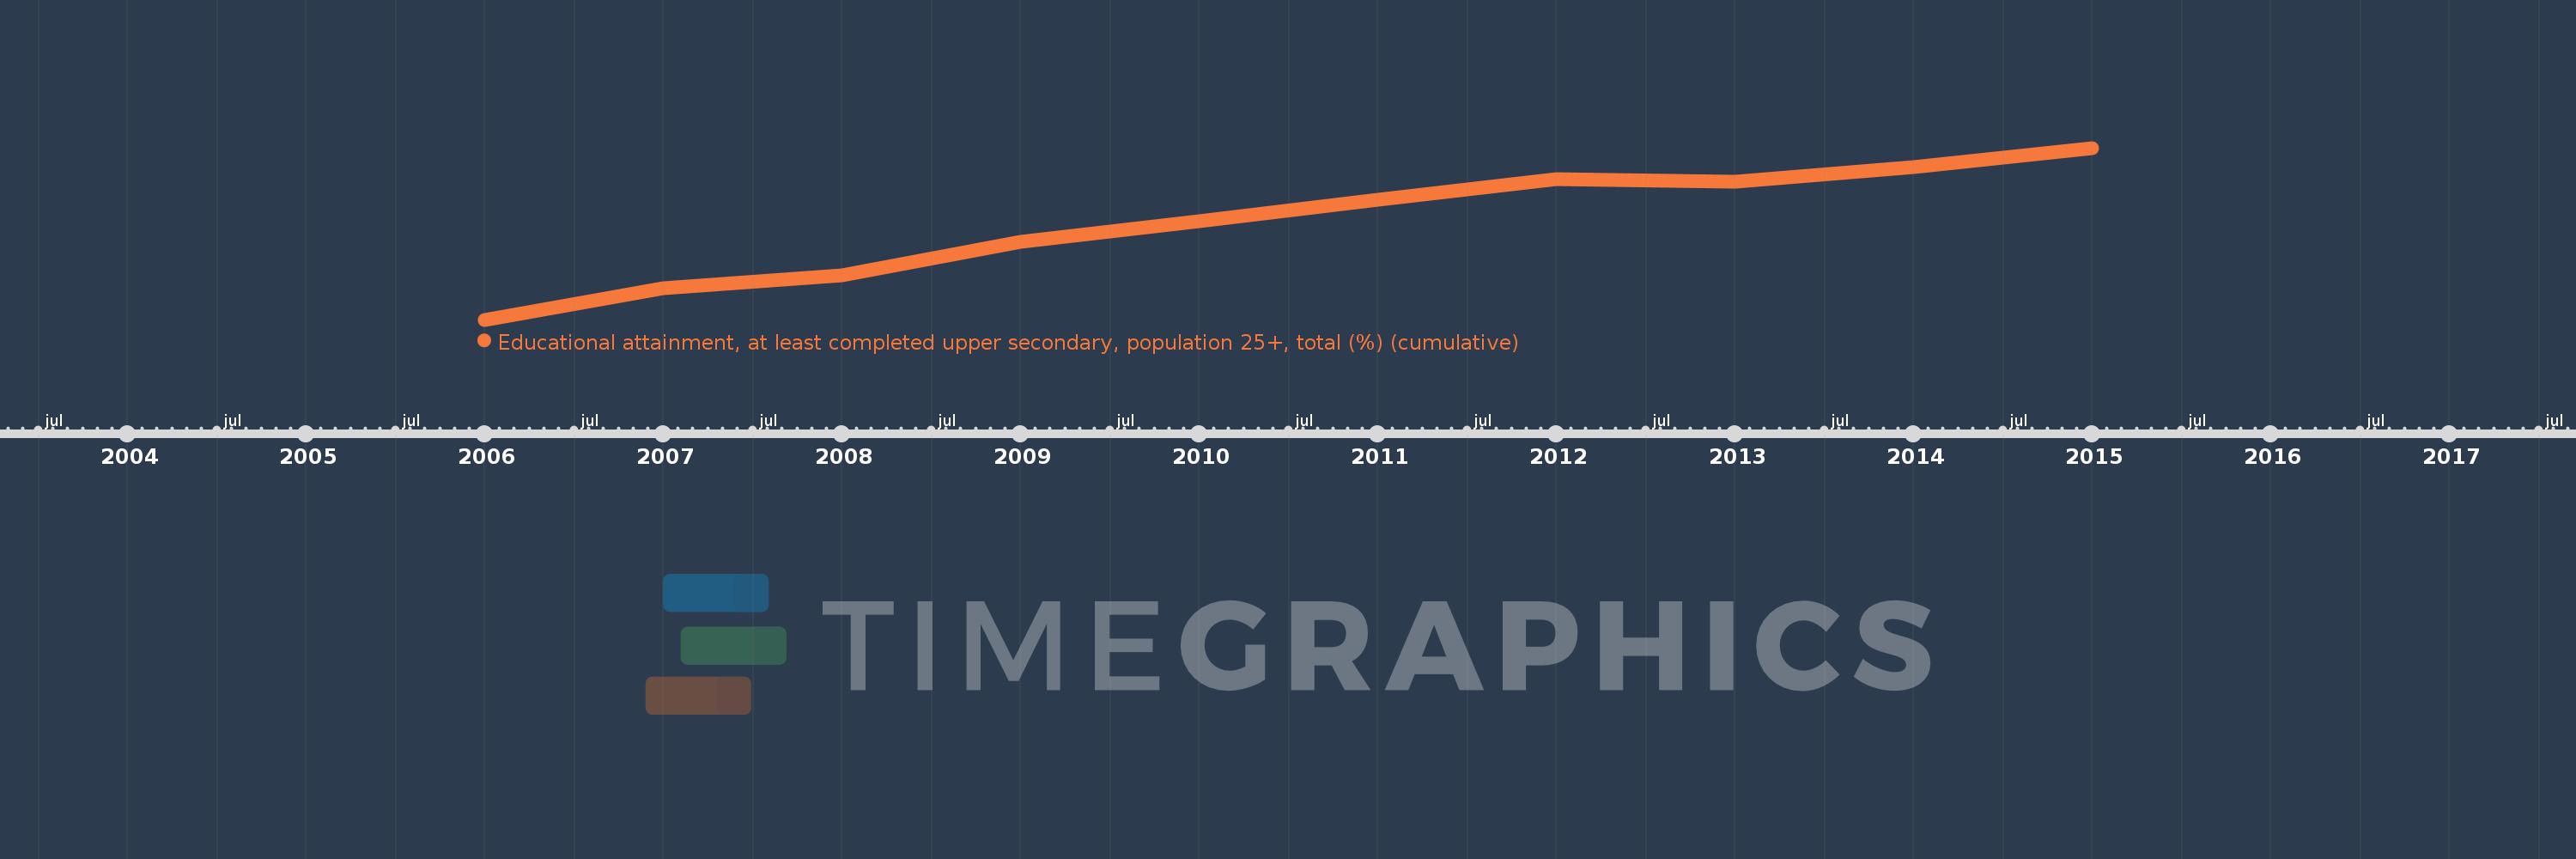
Questa scala temporale mostra un grafico dal 2006 anno al 2015 anno. Lithuania. I dati fino ad 2005 anno non disponibili. Il numero di osservazioni attuali secondo i date: 10.
La fonte (nome):
Indicatori dello sviluppo mondiale
La fonte (organizzazione):
United Nations Educational, Scientific, and Cultural Organization (UNESCO) Institute for Statistics.
Categorie:
Education, Gender
sono stati aggiornati
23 apr 2017 anni
Indicatori delle variazioni dei valori per anni
In media:
79.375
Minima:
74.177
1 gen 2006 anni
Massimo:
83.329
1 gen 2015 anni
Alla data di osservazione
Valore
Variazione assoluta
La variazione rispetto al valore precedente
1 gen 2006 anni
74.177
+74.177
0.0%
1 gen 2007 anni
75.855
+1.678
2.26%
1 gen 2008 anni
76.535
+0.68
0.9%
1 gen 2009 anni
78.35
+1.815
2.37%
1 gen 2010 anni
79.427
+1.077
1.37%
1 gen 2011 anni
80.55
+1.123
1.41%
1 gen 2012 anni
81.666
+1.116
1.39%
1 gen 2013 anni
81.553
-0.113
-0.14%
1 gen 2014 anni
82.31
+0.757
0.93%
1 gen 2015 anni
83.329
+1.019
1.24%
Classificazione dei paesi secondo i statistiche attuali per anni
