29
/
en
AIzaSyAYiBZKx7MnpbEhh9jyipgxe19OcubqV5w
April 1, 2024
81083
Belarus
BLR
true
2
1
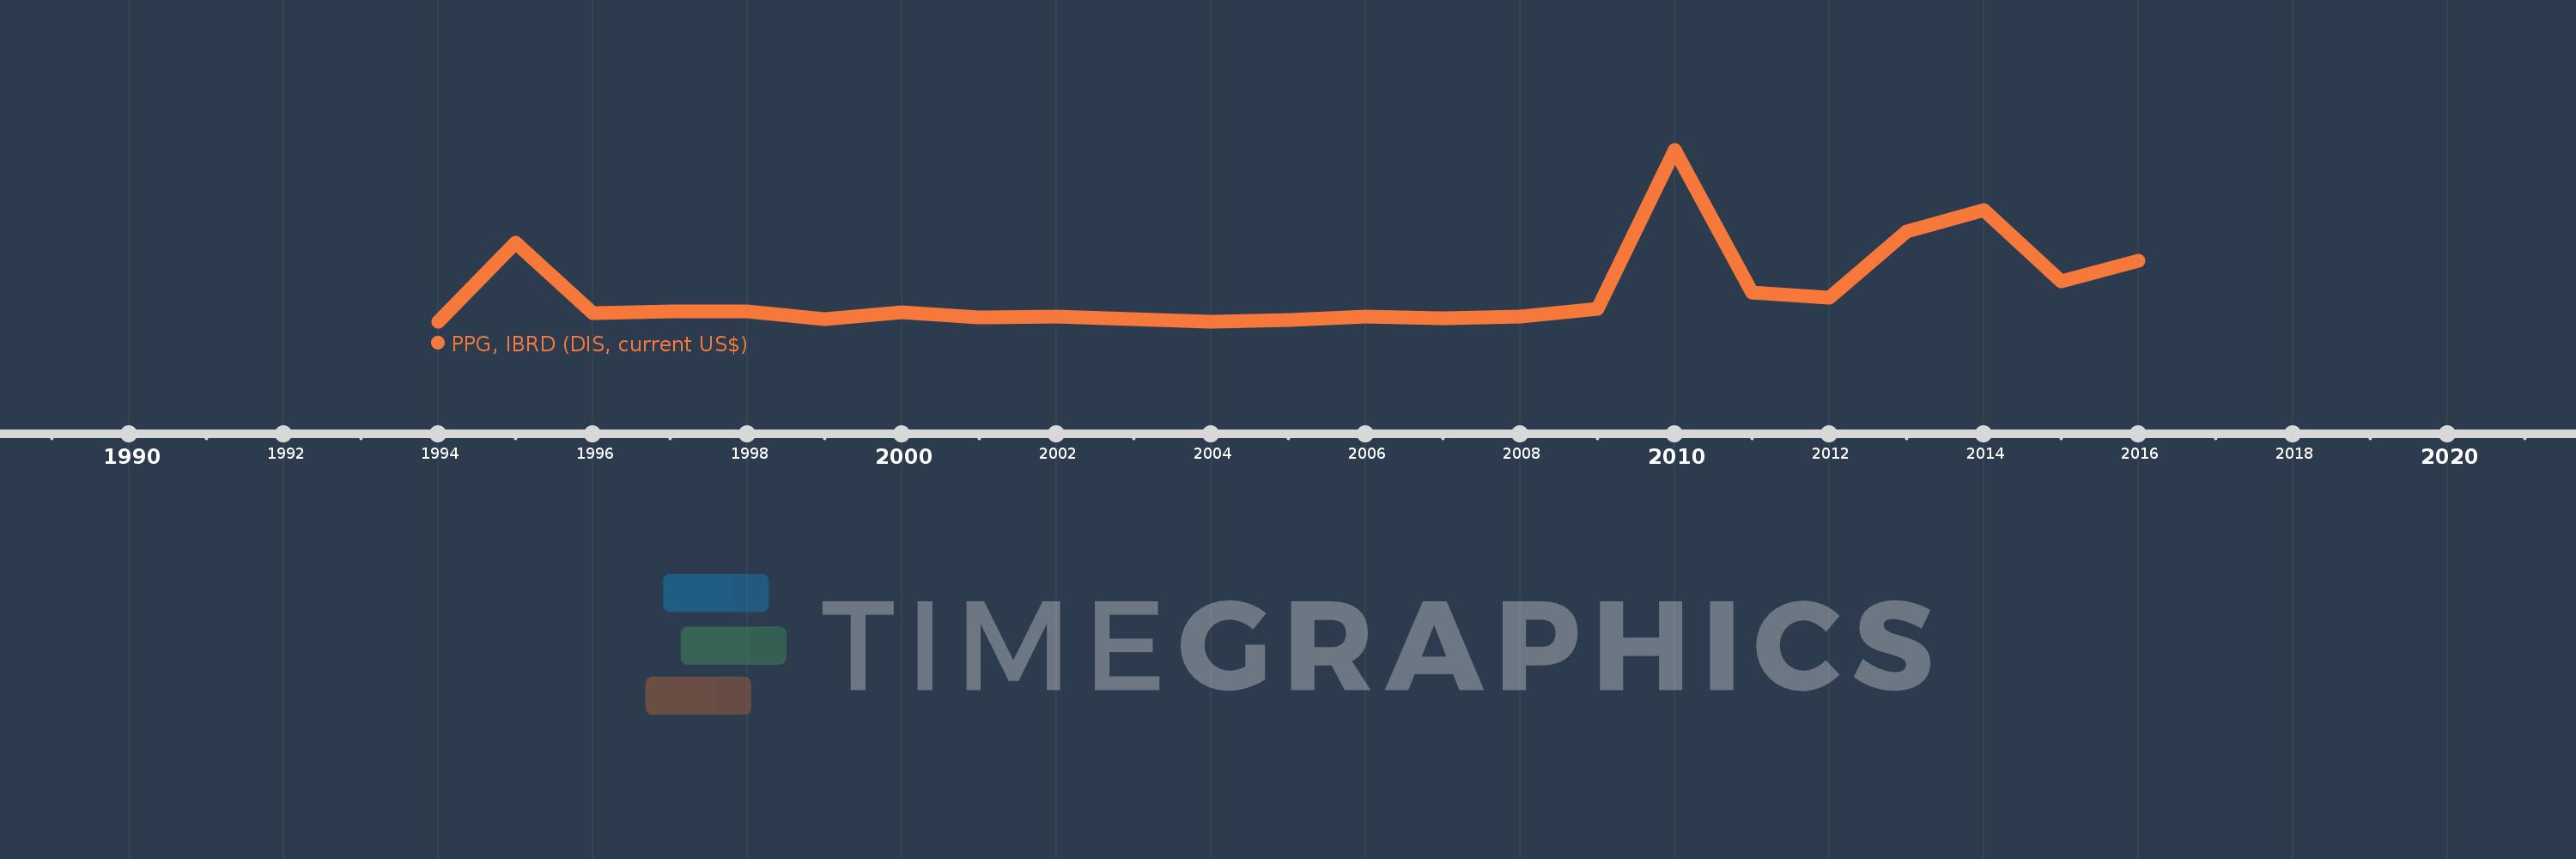
PPG, IBRD (DIS, current US$)
2016,2015,2014,2013,2012,2011,2010,2009,2008,2007,2006,2005,2004,2003,2002,2001,2000,1999,1998,1997,1996,1995,1994
This statistics in other country:
Timeline:
This timeline shows a graph from 1994 to 2016 of Belarus. No data until 1993. Number of actual observations by date: 23.
Source name:
World Development Indicators
Source organization:
World Bank, International Debt Statistics.
Categories, topics:
External Debt
Last updated:
apr 23, 2017
Indicators value changes by year
Minimum:
100.0K
jan 1, 1994
Maximum:
216.17 mln
jan 1, 2010
At the date of observation
Value
Absolute change
Change from previous value
jan 1, 1994
100.0K
+100.0K
0.0%
jan 1, 1995
100.142 mln
+100.042 mln
100.04K%
jan 1, 1996
11.228 mln
-88.914 mln
-88.79%
jan 1, 1997
13.881 mln
+2.653 mln
23.63%
jan 1, 1998
13.343 mln
-538.0K
-3.88%
jan 1, 1999
3.567 mln
-9.776 mln
-73.27%
jan 1, 2000
12.531 mln
+8.964 mln
251.3%
jan 1, 2001
5.511 mln
-7.02 mln
-56.02%
jan 1, 2002
6.424 mln
+913.0K
16.57%
jan 1, 2003
3.86 mln
-2.564 mln
-39.91%
jan 1, 2004
592.0K
-3.268 mln
-84.66%
jan 1, 2005
2.37 mln
+1.778 mln
300.34%
jan 1, 2006
6.841 mln
+4.471 mln
188.65%
jan 1, 2007
5.205 mln
-1.636 mln
-23.91%
jan 1, 2008
7.424 mln
+2.219 mln
42.63%
jan 1, 2009
16.371 mln
+8.947 mln
120.51%
jan 1, 2010
216.17 mln
+199.799 mln
1.22K%
jan 1, 2011
36.788 mln
-179.382 mln
-82.98%
jan 1, 2012
30.154 mln
-6.634 mln
-18.03%
jan 1, 2013
113.452 mln
+83.298 mln
276.24%
jan 1, 2014
140.737 mln
+27.285 mln
24.05%
jan 1, 2015
51.401 mln
-89.336 mln
-63.48%
jan 1, 2016
77.125 mln
+25.724 mln
50.05%
Ranking of countries by current statistics by years


Comments: