29
/
en
AIzaSyAYiBZKx7MnpbEhh9jyipgxe19OcubqV5w
April 1, 2024
104088
Chad
TCD
true
2
1
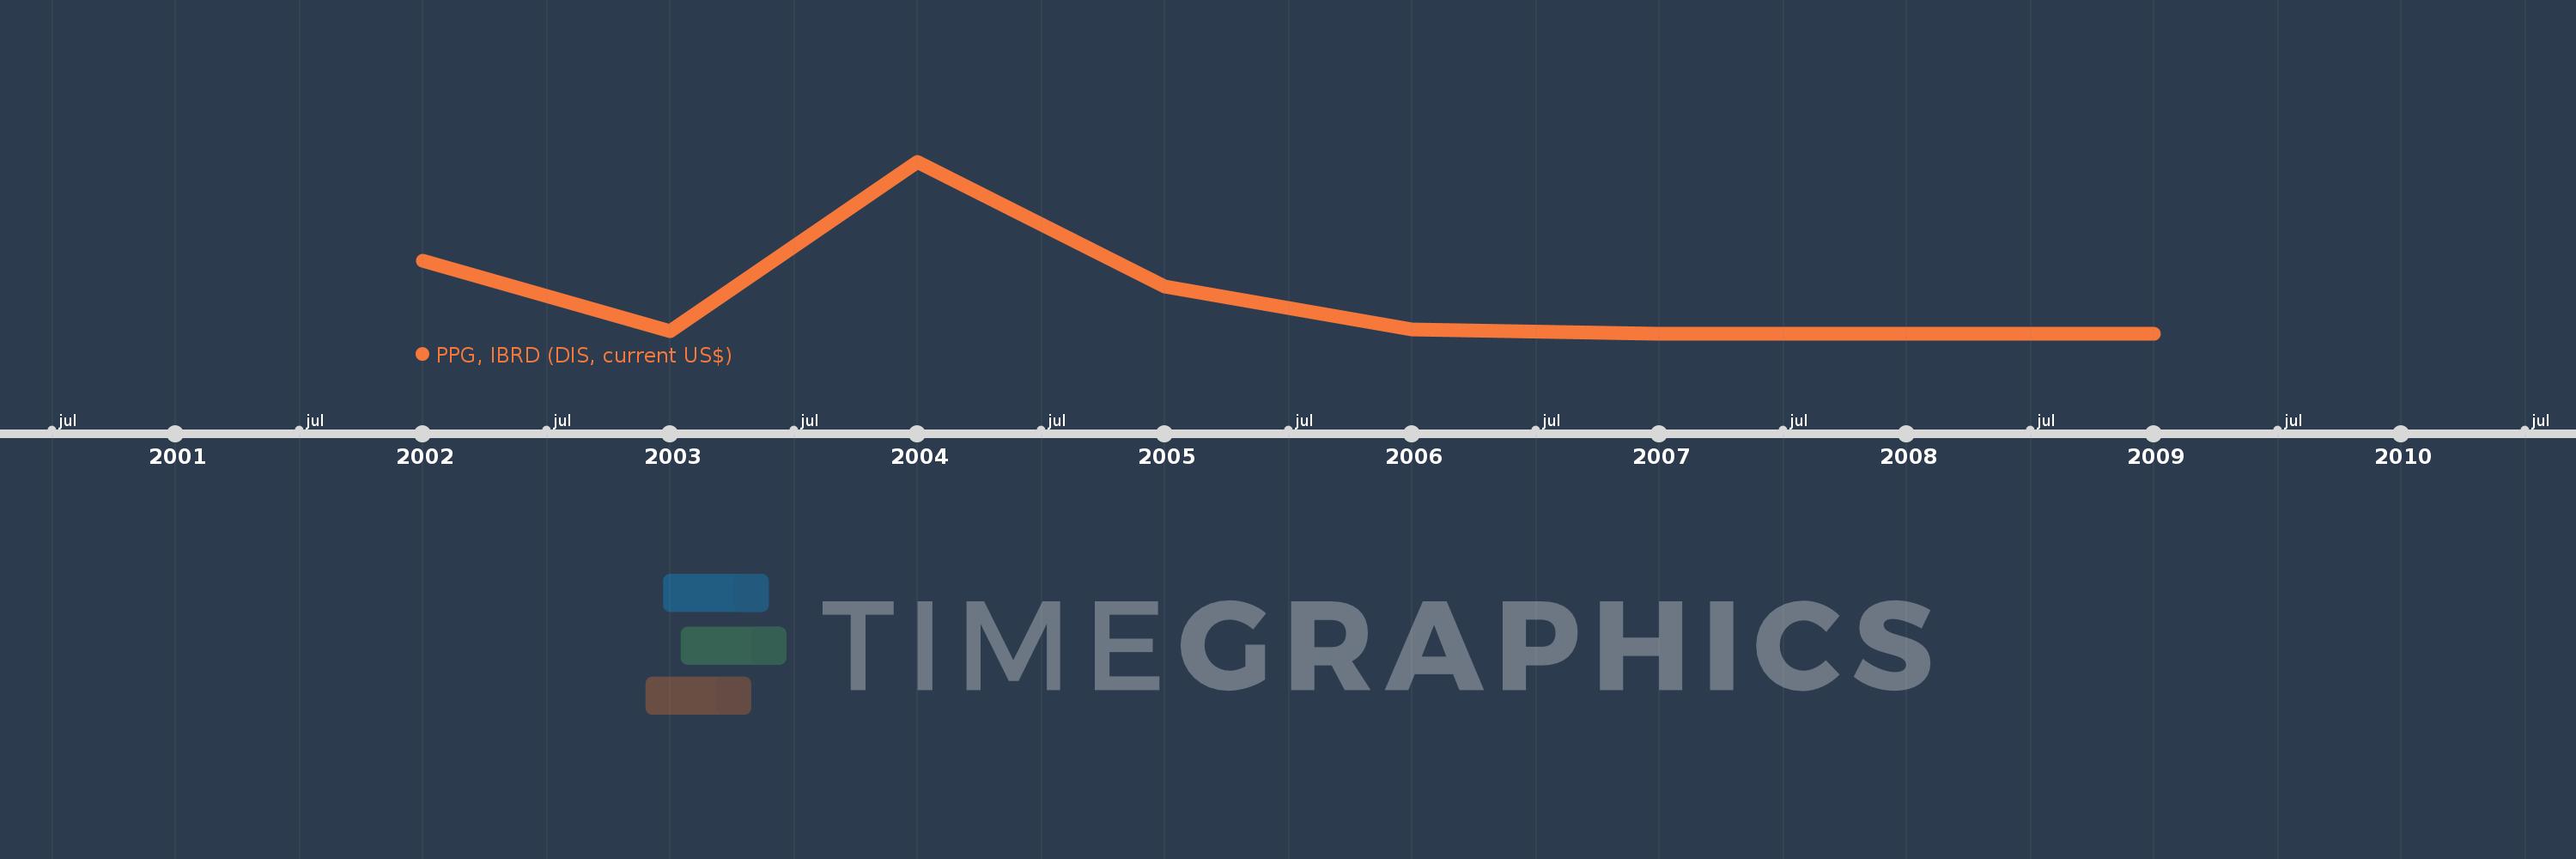
PPG, IBRD (DIS, current US$)
2009,2008,2007,2006,2005,2004,2003,2002
This statistics in other country:
Timeline:
This timeline shows a graph from 2002 to 2009 of Chad. No data until 2001. Number of actual observations by date: 8.
Source name:
World Development Indicators
Source organization:
World Bank, International Debt Statistics.
Categories, topics:
External Debt
Last updated:
apr 23, 2017
Indicators value changes by year
Maximum:
21.563 mln
jan 1, 2004
At the date of observation
Value
Absolute change
Change from previous value
jan 1, 2002
9.065 mln
+9.065 mln
0.0%
jan 1, 2003
276.0K
-8.789 mln
-96.96%
jan 1, 2004
21.563 mln
+21.287 mln
7.71K%
jan 1, 2005
5.919 mln
-15.644 mln
-72.55%
jan 1, 2006
536.0K
-5.383 mln
-90.94%
jan 1, 2007
0.0
-536.0K
-100.0%
Ranking of countries by current statistics by years


Comments: