29
/
en
AIzaSyAYiBZKx7MnpbEhh9jyipgxe19OcubqV5w
April 1, 2024
200868
Montenegro
MNE
true
2
1
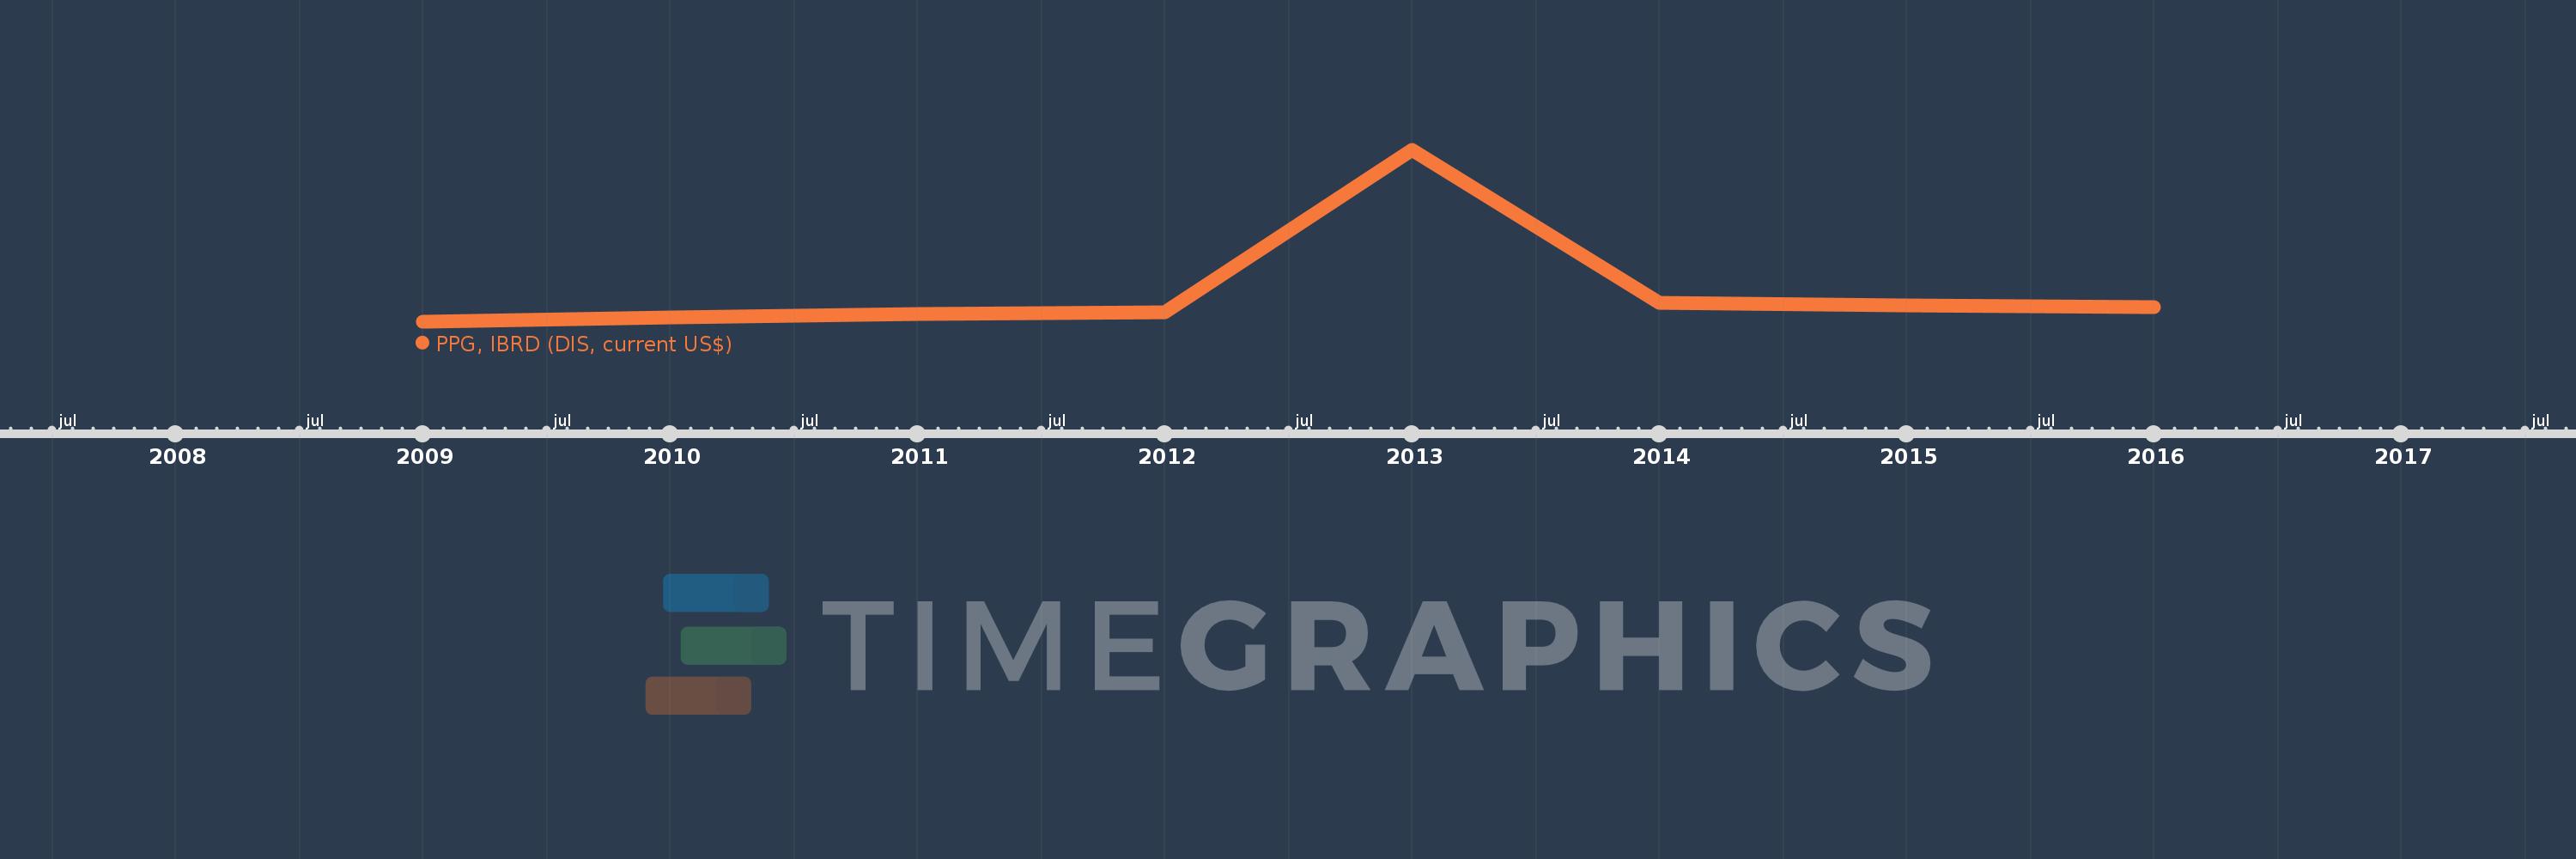
PPG, IBRD (DIS, current US$)
2016,2015,2014,2013,2012,2011,2010,2009
This statistics in other country:
Timeline:
This timeline shows a graph from 2009 to 2016 of Montenegro. No data until 2008. Number of actual observations by date: 8.
Source name:
World Development Indicators
Source organization:
World Bank, International Debt Statistics.
Categories, topics:
External Debt
Last updated:
apr 23, 2017
Indicators value changes by year
Maximum:
96.833 mln
jan 1, 2013
At the date of observation
Value
Absolute change
Change from previous value
jan 1, 2010
2.714 mln
+2.714 mln
%
jan 1, 2011
4.56 mln
+1.846 mln
68.02%
jan 1, 2012
5.279 mln
+719.0K
15.77%
jan 1, 2013
96.833 mln
+91.554 mln
1.73K%
jan 1, 2014
10.662 mln
-86.171 mln
-88.99%
jan 1, 2015
9.454 mln
-1.208 mln
-11.33%
jan 1, 2016
8.416 mln
-1.038 mln
-10.98%
Ranking of countries by current statistics by years


Comments: