29
/
en
AIzaSyAYiBZKx7MnpbEhh9jyipgxe19OcubqV5w
April 1, 2024
198104
Moldova
MDA
true
2
1
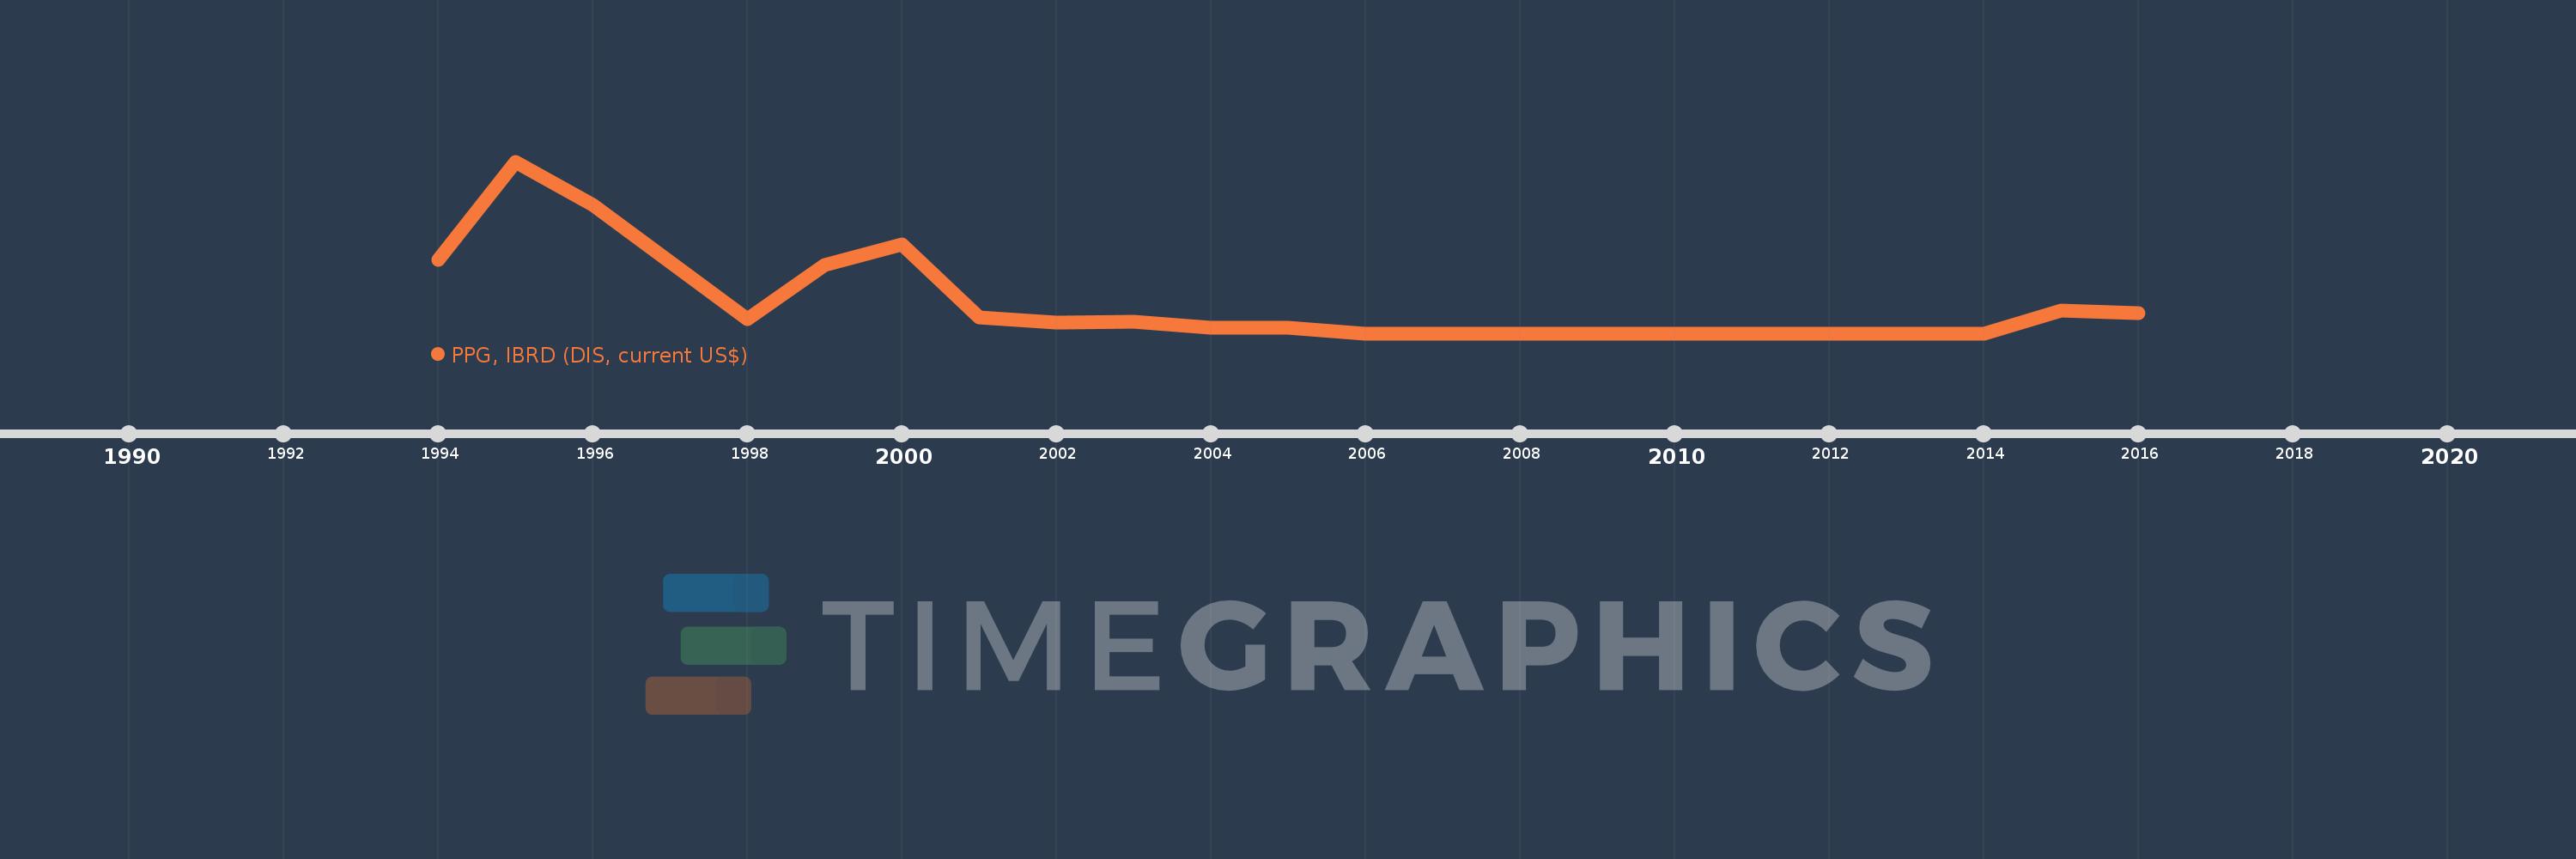
PPG, IBRD (DIS, current US$)
2016,2015,2014,2013,2011,2010,2009,2008,2007,2006,2005,2004,2003,2002,2001,2000,1999,1998,1996,1995,1994
This statistics in other country:
Timeline:
This timeline shows a graph from 1994 to 2016 of Moldova. No data until 1993. Number of actual observations by date: 21.
Source name:
World Development Indicators
Source organization:
World Bank, International Debt Statistics.
Categories, topics:
External Debt
Last updated:
apr 23, 2017
Indicators value changes by year
Maximum:
67.092 mln
jan 1, 1995
At the date of observation
Value
Absolute change
Change from previous value
jan 1, 1994
28.573 mln
+28.573 mln
0.0%
jan 1, 1995
67.092 mln
+38.519 mln
134.81%
jan 1, 1996
50.158 mln
-16.934 mln
-25.24%
jan 1, 1998
5.394 mln
-44.764 mln
-89.25%
jan 1, 1999
26.566 mln
+21.172 mln
392.51%
jan 1, 2000
34.836 mln
+8.27 mln
31.13%
jan 1, 2001
6.051 mln
-28.785 mln
-82.63%
jan 1, 2002
4.117 mln
-1.934 mln
-31.96%
jan 1, 2003
4.366 mln
+249.0K
6.05%
jan 1, 2004
2.322 mln
-2.044 mln
-46.82%
jan 1, 2005
2.281 mln
-41.0K
-1.77%
jan 1, 2006
0.0
-2.281 mln
-100.0%
jan 1, 2015
9.0 mln
+9.0 mln
%
jan 1, 2016
7.728 mln
-1.272 mln
-14.13%
Ranking of countries by current statistics by years


Comments: