29
/
en
AIzaSyAYiBZKx7MnpbEhh9jyipgxe19OcubqV5w
April 1, 2024
246143
South Africa
ZAF
true
2
1
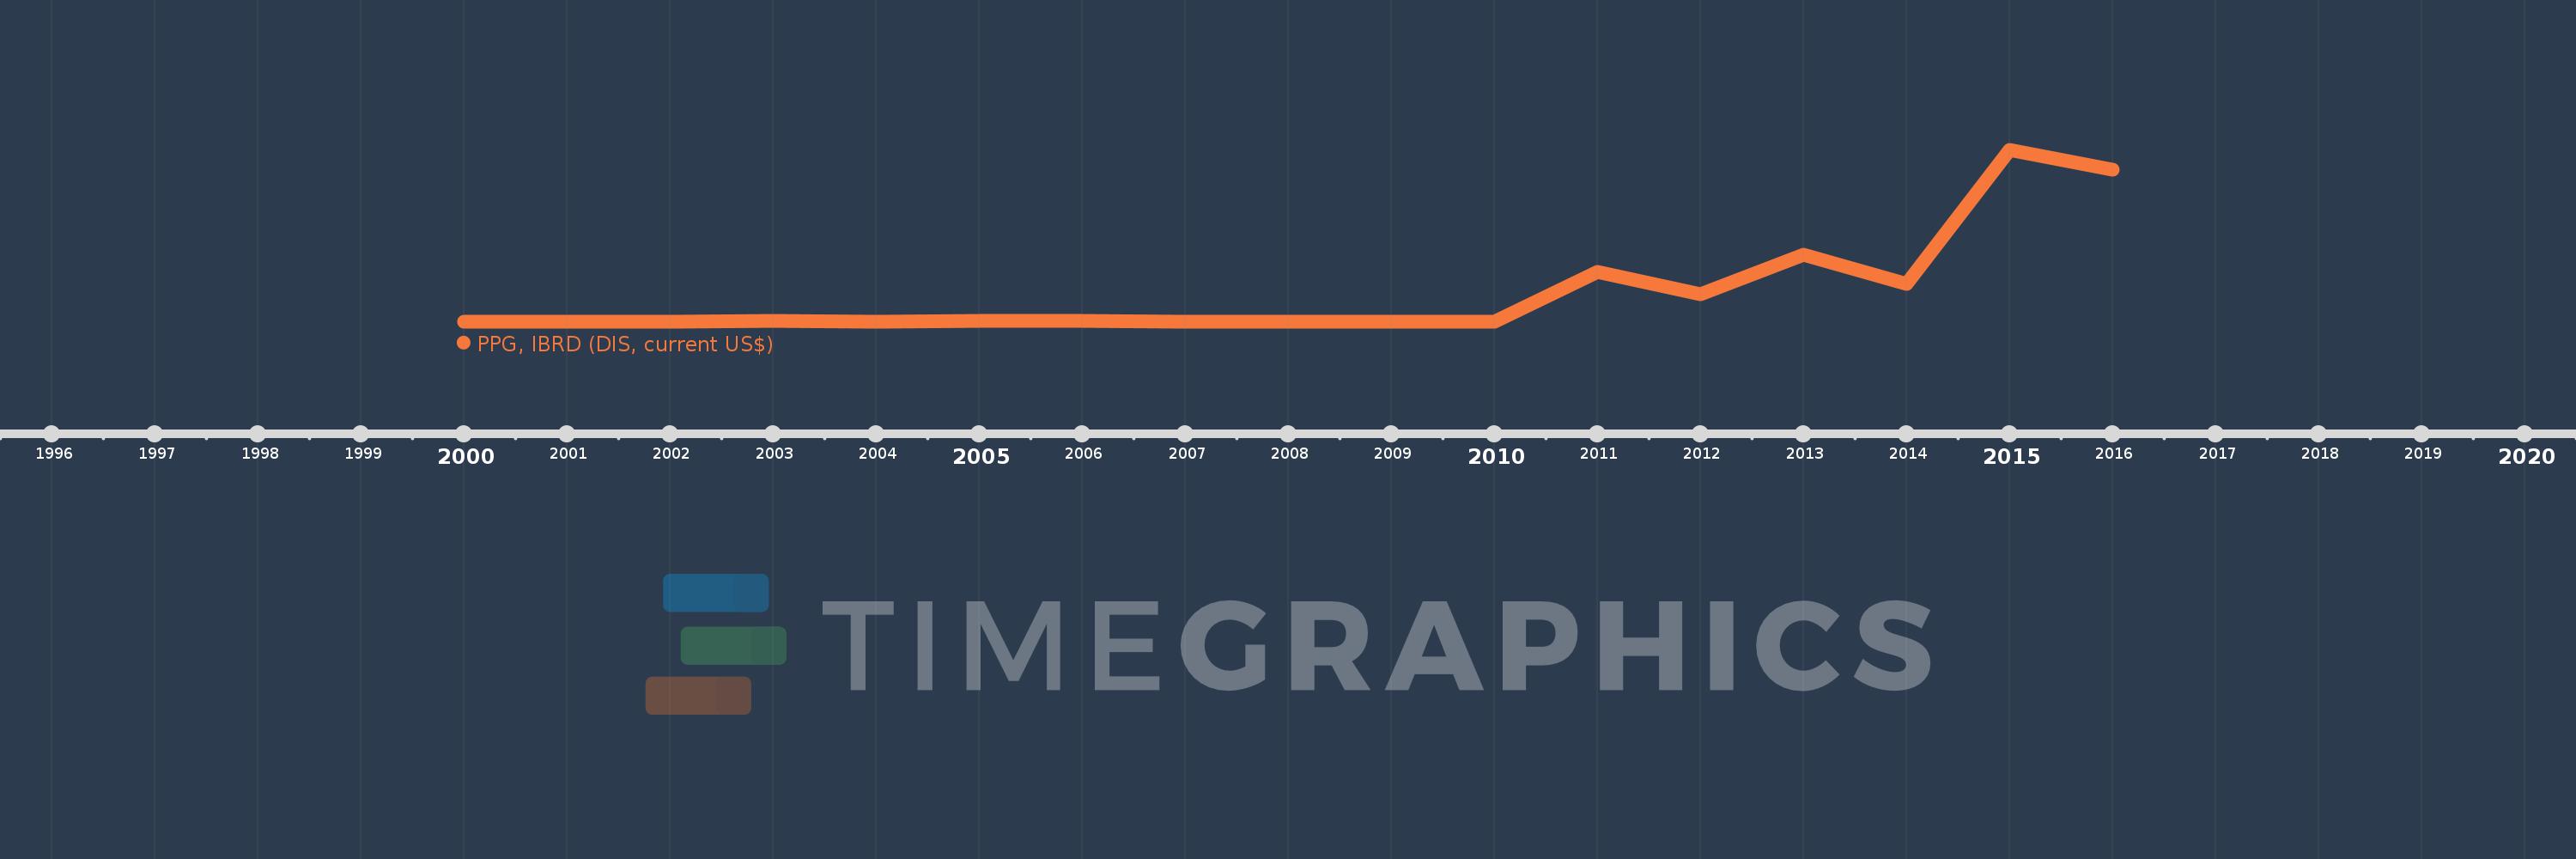
PPG, IBRD (DIS, current US$)
2016,2015,2014,2013,2012,2011,2010,2009,2008,2007,2006,2005,2004,2003,2002,2001,2000
This statistics in other country:
Timeline:
This timeline shows a graph from 2000 to 2016 of South Africa. No data until 1999. Number of actual observations by date: 17.
Source name:
World Development Indicators
Source organization:
World Bank, International Debt Statistics.
Categories, topics:
External Debt
Last updated:
apr 23, 2017
Indicators value changes by year
Maximum:
1.27 bln
jan 1, 2015
At the date of observation
Value
Absolute change
Change from previous value
jan 1, 2000
710.0K
+710.0K
0.0%
jan 1, 2001
2.661 mln
+1.951 mln
274.79%
jan 1, 2002
3.985 mln
+1.324 mln
49.76%
jan 1, 2003
5.142 mln
+1.157 mln
29.03%
jan 1, 2004
3.194 mln
-1.948 mln
-37.88%
jan 1, 2005
7.385 mln
+4.191 mln
131.21%
jan 1, 2006
9.355 mln
+1.97 mln
26.68%
jan 1, 2007
0.0
-9.355 mln
-100.0%
jan 1, 2009
3.103 mln
+3.103 mln
%
jan 1, 2010
0.0
-3.103 mln
-100.0%
jan 1, 2011
370.989 mln
+370.989 mln
%
jan 1, 2012
207.523 mln
-163.466 mln
-44.06%
jan 1, 2013
498.499 mln
+290.976 mln
140.21%
jan 1, 2014
284.362 mln
-214.137 mln
-42.96%
jan 1, 2015
1.27 bln
+985.746 mln
346.65%
jan 1, 2016
1.123 bln
-146.704 mln
-11.55%
Ranking of countries by current statistics by years


Comments: