29
/
en
AIzaSyAYiBZKx7MnpbEhh9jyipgxe19OcubqV5w
April 1, 2024
143426
Grenada
GRD
true
2
1
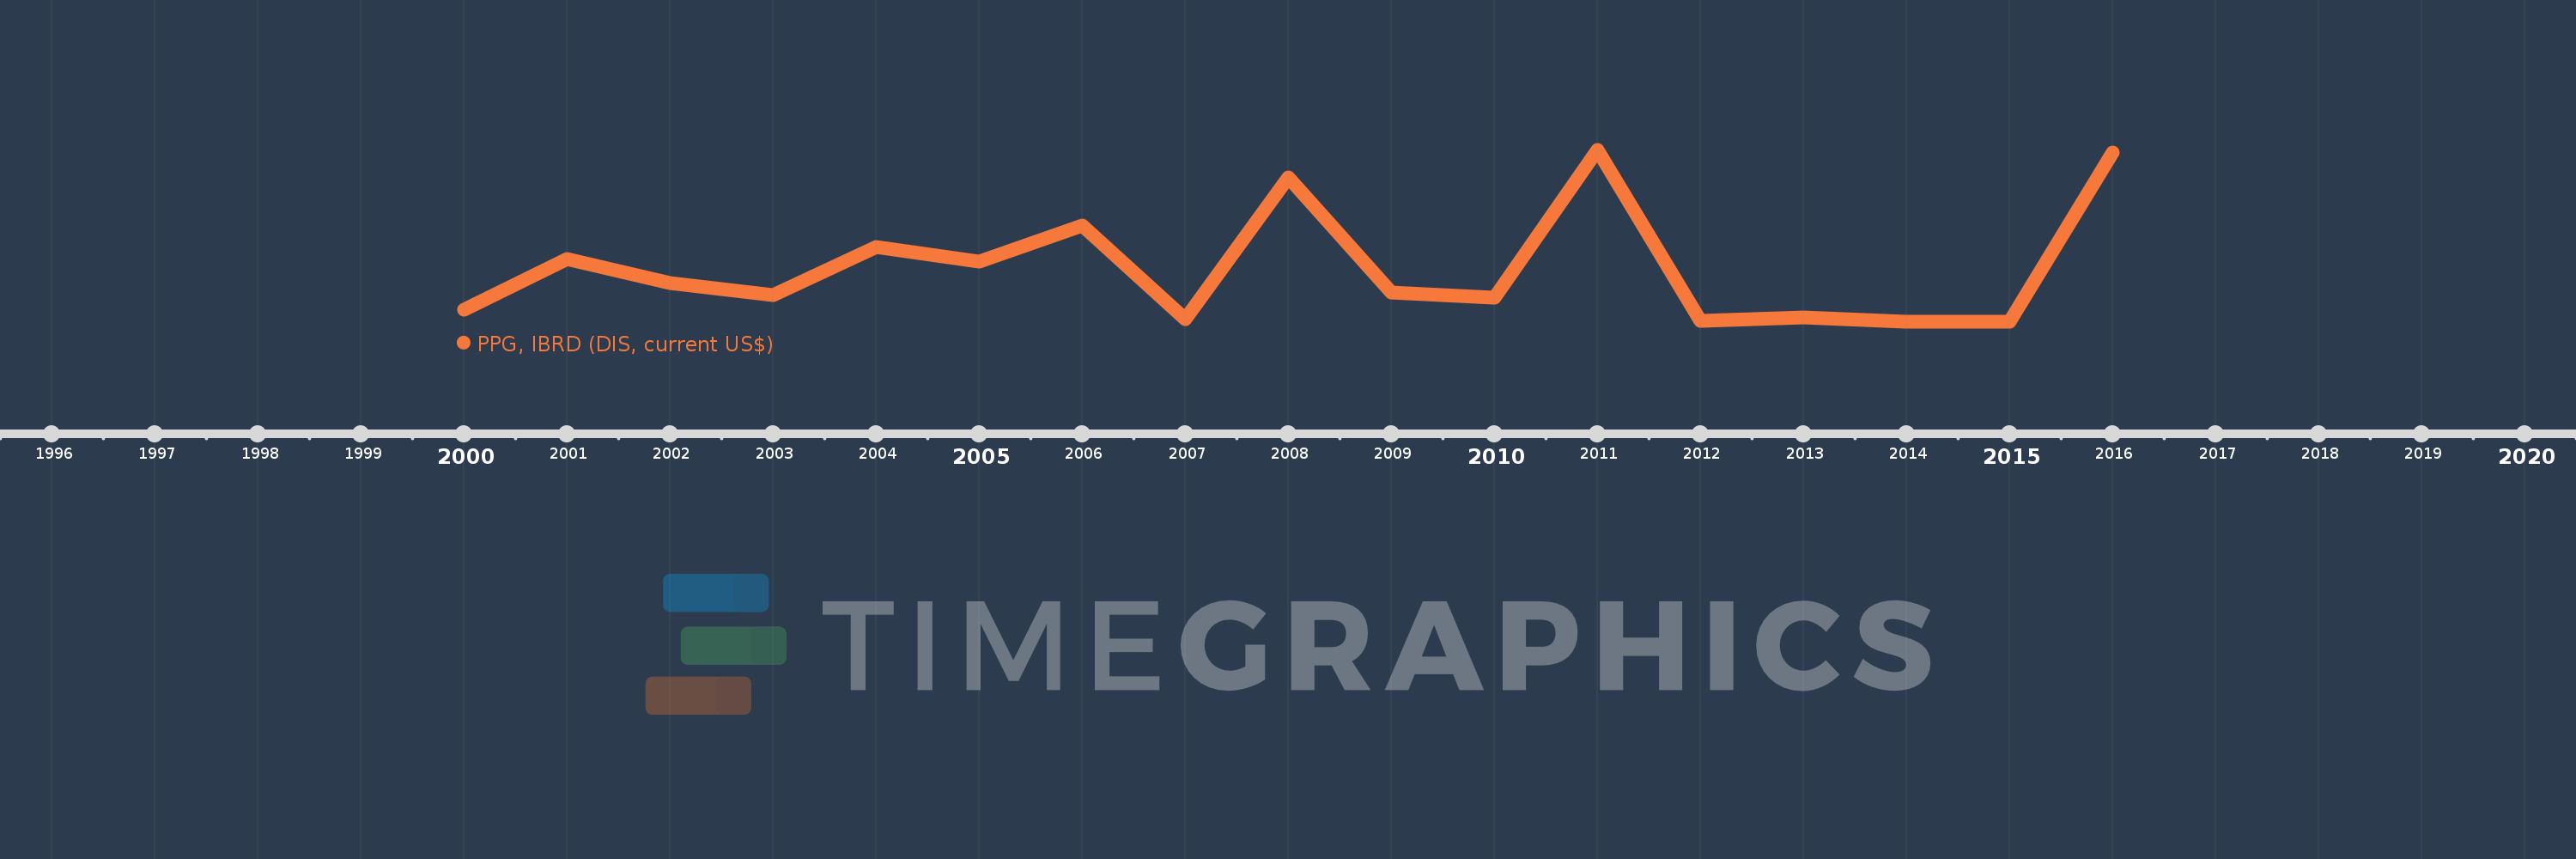
PPG, IBRD (DIS, current US$)
2016,2015,2014,2013,2012,2011,2010,2009,2008,2007,2006,2005,2004,2003,2002,2001,2000
This statistics in other country:
Timeline:
This timeline shows a graph from 2000 to 2016 of Grenada. No data until 1999. Number of actual observations by date: 17.
Source name:
World Development Indicators
Source organization:
World Bank, International Debt Statistics.
Categories, topics:
External Debt
Last updated:
apr 23, 2017
Indicators value changes by year
Maximum:
5.067 mln
jan 1, 2011
At the date of observation
Value
Absolute change
Change from previous value
jan 1, 2000
367.0K
+367.0K
0.0%
jan 1, 2001
1.863 mln
+1.496 mln
407.63%
jan 1, 2002
1.149 mln
-714.0K
-38.33%
jan 1, 2003
795.0K
-354.0K
-30.81%
jan 1, 2004
2.221 mln
+1.426 mln
179.37%
jan 1, 2005
1.775 mln
-446.0K
-20.08%
jan 1, 2006
2.834 mln
+1.059 mln
59.66%
jan 1, 2007
85.0K
-2.749 mln
-97.0%
jan 1, 2008
4.261 mln
+4.176 mln
4.91K%
jan 1, 2009
879.0K
-3.382 mln
-79.37%
jan 1, 2010
710.0K
-169.0K
-19.23%
jan 1, 2011
5.067 mln
+4.357 mln
613.66%
jan 1, 2012
36.0K
-5.031 mln
-99.29%
jan 1, 2013
137.0K
+101.0K
280.56%
jan 1, 2014
0.0
-137.0K
-100.0%
jan 1, 2016
5.0 mln
+5.0 mln
%
Ranking of countries by current statistics by years


Comments: