29
/
en
AIzaSyAYiBZKx7MnpbEhh9jyipgxe19OcubqV5w
April 1, 2024
80489
Belarus
BLR
true
2
1
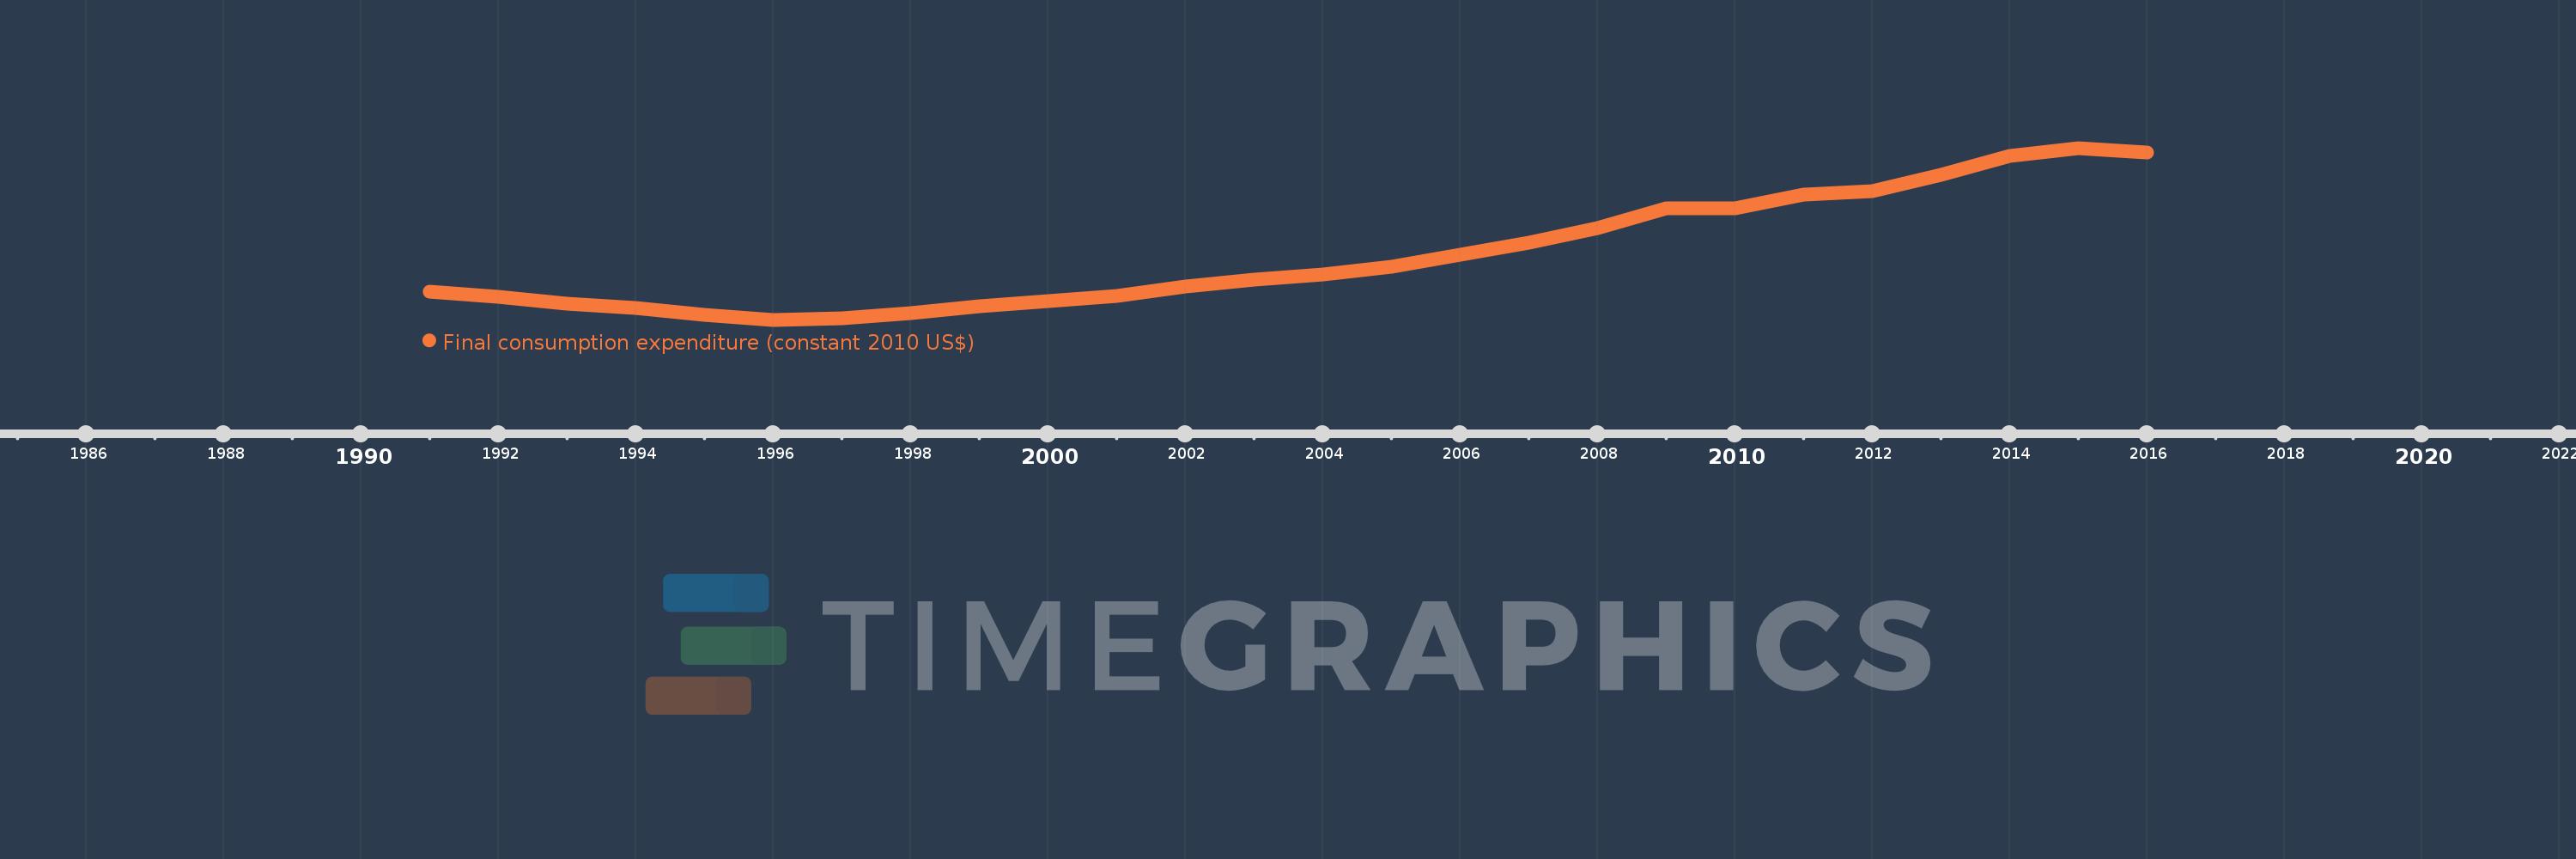
Final consumption expenditure (constant 2010 US$)
2016,2015,2014,2013,2012,2011,2010,2009,2008,2007,2006,2005,2004,2003,2002,2001,2000,1999,1998,1997,1996,1995,1994,1993,1992,1991
This statistics in other country:
AfghanistanAlbaniaAlgeriaAngolaAntigua and BarbudaArab WorldArgentinaArmeniaArubaAustraliaAustriaAzerbaijanBahamas, TheBahrainBangladeshBarbadosBelarusBelgiumBelizeBeninBermudaBhutanBoliviaBosnia and HerzegovinaBotswanaBrazilBrunei DarussalamBulgariaBurkina FasoBurundiCabo VerdeCambodiaCameroonCanadaCaribbean small statesCentral African RepublicCentral Europe and the BalticsChadChileChinaColombiaComorosCongo, Dem. Rep.Congo, Rep.Costa RicaCote d'IvoireCroatiaCubaCyprusCzech RepublicDenmarkDominicaDominican RepublicEarly-demographic dividendEast Asia & PacificEast Asia & Pacific (excluding high income)East Asia & Pacific (IDA & IBRD countries)EcuadorEgypt, Arab Rep.El SalvadorEquatorial GuineaEritreaEstoniaEuro areaEurope & Central AsiaEurope & Central Asia (excluding high income)Europe & Central Asia (IDA & IBRD countries)European UnionFaroe IslandsFinlandFranceGabonGambia, TheGeorgiaGermanyGhanaGreeceGrenadaGuatemalaGuineaGuinea-BissauGuyanaHaitiHeavily indebted poor countries (HIPC)High incomeHondurasHong Kong SAR, ChinaHungaryIBRD onlyIcelandIDA & IBRD totalIDA blendIDA onlyIDA totalIndiaIndonesiaIran, Islamic Rep.IrelandIsraelItalyJamaicaJapanJordanKazakhstanKenyaKorea, Rep.KosovoKuwaitKyrgyz RepublicLao PDRLate-demographic dividendLatin America & Caribbean Latin America & Caribbean (excluding high income)Latin America & the Caribbean (IDA & IBRD countries)LatviaLeast developed countries: UN classificationLebanonLiberiaLithuaniaLow & middle incomeLow incomeLower middle incomeLuxembourgMacao SAR, ChinaMacedonia, FYRMadagascarMalawiMalaysiaMaliMaltaMauritaniaMauritiusMexicoMiddle East & North AfricaMiddle East & North Africa (excluding high income)Middle East & North Africa (IDA & IBRD countries)Middle incomeMoldovaMongoliaMontenegroMoroccoMozambiqueNamibiaNepalNetherlandsNew ZealandNicaraguaNigerNigeriaNorth AmericaNorwayOECD membersOmanOther small statesPakistanPanamaParaguayPeruPhilippinesPolandPortugalPost-demographic dividendPre-demographic dividendPuerto RicoQatarRomaniaRussian FederationRwandaSaudi ArabiaSenegalSerbiaSeychellesSierra LeoneSingaporeSlovak RepublicSloveniaSmall statesSouth AfricaSouth AsiaSouth Asia (IDA & IBRD)South SudanSpainSri LankaSt. Kitts and NevisSt. LuciaSt. Vincent and the GrenadinesSub-Saharan Africa Sub-Saharan Africa (excluding high income)Sub-Saharan Africa (IDA & IBRD countries)SudanSurinameSwazilandSwedenSwitzerlandTajikistanTanzaniaThailandTimor-LesteTogoTongaTrinidad and TobagoTunisiaTurkeyUgandaUkraineUnited Arab EmiratesUnited KingdomUnited StatesUpper middle incomeUruguayUzbekistanVanuatuVenezuela, RBVietnamWest Bank and GazaWorldYemen, Rep.ZambiaZimbabwe Timeline:
This timeline shows a graph from 1991 to 2016 of Belarus. No data until 1990. Number of actual observations by date: 26.
Source name:
World Development Indicators
Source organization:
World Bank national accounts data, and OECD National Accounts data files.
Categories, topics:
Economy & Growth
Last updated:
apr 23, 2017
Indicators value changes by year
Minimum:
11.214 bln
jan 1, 1996
Maximum:
49.72 bln
jan 1, 2015
At the date of observation
Value
Absolute change
Change from previous value
jan 1, 1991
17.59 bln
+17.59 bln
0.0%
jan 1, 1992
16.437 bln
-1.153 bln
-6.56%
jan 1, 1993
14.823 bln
-1.614 bln
-9.82%
jan 1, 1994
13.863 bln
-959.842 mln
-6.48%
jan 1, 1995
12.334 bln
-1.529 bln
-11.03%
jan 1, 1996
11.214 bln
-1.12 bln
-9.08%
jan 1, 1997
11.592 bln
+377.941 mln
3.37%
jan 1, 1998
12.728 bln
+1.137 bln
9.81%
jan 1, 1999
14.189 bln
+1.46 bln
11.47%
jan 1, 2000
15.356 bln
+1.167 bln
8.23%
jan 1, 2001
16.474 bln
+1.118 bln
7.28%
jan 1, 2002
18.737 bln
+2.263 bln
13.74%
jan 1, 2003
20.278 bln
+1.542 bln
8.23%
jan 1, 2004
21.436 bln
+1.157 bln
5.71%
jan 1, 2005
23.04 bln
+1.604 bln
7.48%
jan 1, 2006
25.8 bln
+2.761 bln
11.98%
jan 1, 2007
28.524 bln
+2.724 bln
10.56%
jan 1, 2008
31.741 bln
+3.216 bln
11.28%
jan 1, 2009
36.239 bln
+4.498 bln
14.17%
jan 1, 2010
36.236 bln
-3.376 mln
-0.01%
jan 1, 2011
39.354 bln
+3.118 bln
8.6%
jan 1, 2012
39.987 bln
+633.792 mln
1.61%
jan 1, 2013
43.759 bln
+3.771 bln
9.43%
jan 1, 2014
47.934 bln
+4.176 bln
9.54%
jan 1, 2015
49.72 bln
+1.786 bln
3.73%
jan 1, 2016
48.627 bln
-1.093 bln
-2.2%
Ranking of countries by current statistics by years


Comments: