29
/
en
AIzaSyAYiBZKx7MnpbEhh9jyipgxe19OcubqV5w
April 1, 2024
226724
Puerto Rico
PRI
true
2
1
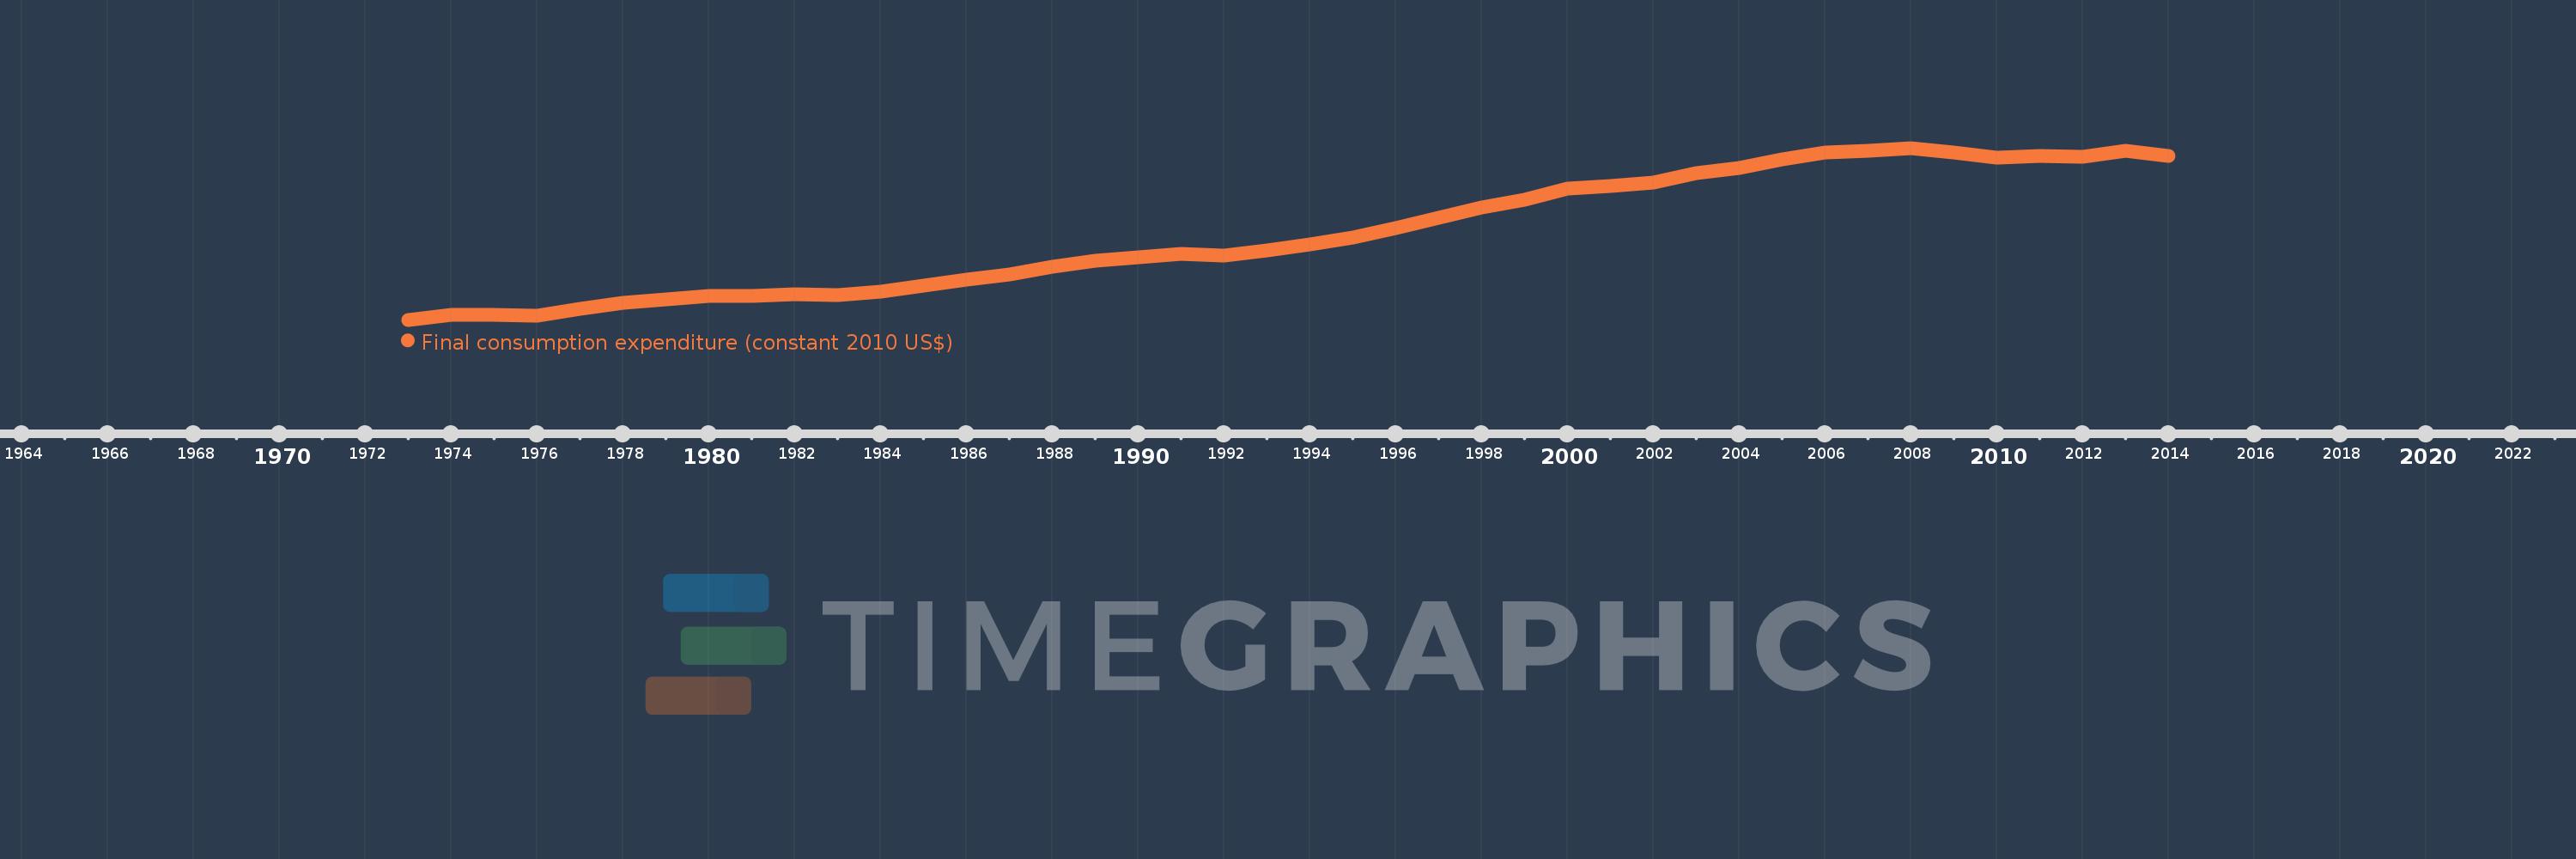
Final consumption expenditure (constant 2010 US$)
2014,2013,2012,2011,2010,2009,2008,2007,2006,2005,2004,2003,2002,2001,2000,1999,1998,1997,1996,1995,1994,1993,1992,1991,1990,1989,1988,1987,1986,1985,1984,1983,1982,1981,1980,1979,1978,1977,1976,1975,1974,1973
This statistics in other country:
AfghanistanAlbaniaAlgeriaAngolaAntigua and BarbudaArab WorldArgentinaArmeniaArubaAustraliaAustriaAzerbaijanBahamas, TheBahrainBangladeshBarbadosBelarusBelgiumBelizeBeninBermudaBhutanBoliviaBosnia and HerzegovinaBotswanaBrazilBrunei DarussalamBulgariaBurkina FasoBurundiCabo VerdeCambodiaCameroonCanadaCaribbean small statesCentral African RepublicCentral Europe and the BalticsChadChileChinaColombiaComorosCongo, Dem. Rep.Congo, Rep.Costa RicaCote d'IvoireCroatiaCubaCyprusCzech RepublicDenmarkDominicaDominican RepublicEarly-demographic dividendEast Asia & PacificEast Asia & Pacific (excluding high income)East Asia & Pacific (IDA & IBRD countries)EcuadorEgypt, Arab Rep.El SalvadorEquatorial GuineaEritreaEstoniaEuro areaEurope & Central AsiaEurope & Central Asia (excluding high income)Europe & Central Asia (IDA & IBRD countries)European UnionFaroe IslandsFinlandFranceGabonGambia, TheGeorgiaGermanyGhanaGreeceGrenadaGuatemalaGuineaGuinea-BissauGuyanaHaitiHeavily indebted poor countries (HIPC)High incomeHondurasHong Kong SAR, ChinaHungaryIBRD onlyIcelandIDA & IBRD totalIDA blendIDA onlyIDA totalIndiaIndonesiaIran, Islamic Rep.IrelandIsraelItalyJamaicaJapanJordanKazakhstanKenyaKorea, Rep.KosovoKuwaitKyrgyz RepublicLao PDRLate-demographic dividendLatin America & Caribbean Latin America & Caribbean (excluding high income)Latin America & the Caribbean (IDA & IBRD countries)LatviaLeast developed countries: UN classificationLebanonLiberiaLithuaniaLow & middle incomeLow incomeLower middle incomeLuxembourgMacao SAR, ChinaMacedonia, FYRMadagascarMalawiMalaysiaMaliMaltaMauritaniaMauritiusMexicoMiddle East & North AfricaMiddle East & North Africa (excluding high income)Middle East & North Africa (IDA & IBRD countries)Middle incomeMoldovaMongoliaMontenegroMoroccoMozambiqueNamibiaNepalNetherlandsNew ZealandNicaraguaNigerNigeriaNorth AmericaNorwayOECD membersOmanOther small statesPakistanPanamaParaguayPeruPhilippinesPolandPortugalPost-demographic dividendPre-demographic dividendPuerto RicoQatarRomaniaRussian FederationRwandaSaudi ArabiaSenegalSerbiaSeychellesSierra LeoneSingaporeSlovak RepublicSloveniaSmall statesSouth AfricaSouth AsiaSouth Asia (IDA & IBRD)South SudanSpainSri LankaSt. Kitts and NevisSt. LuciaSt. Vincent and the GrenadinesSub-Saharan Africa Sub-Saharan Africa (excluding high income)Sub-Saharan Africa (IDA & IBRD countries)SudanSurinameSwazilandSwedenSwitzerlandTajikistanTanzaniaThailandTimor-LesteTogoTongaTrinidad and TobagoTunisiaTurkeyUgandaUkraineUnited Arab EmiratesUnited KingdomUnited StatesUpper middle incomeUruguayUzbekistanVanuatuVenezuela, RBVietnamWest Bank and GazaWorldYemen, Rep.ZambiaZimbabwe Timeline:
This timeline shows a graph from 1973 to 2014 of Puerto Rico. No data until 1972. Number of actual observations by date: 42.
Source name:
World Development Indicators
Source organization:
World Bank national accounts data, and OECD National Accounts data files.
Categories, topics:
Economy & Growth
Last updated:
apr 23, 2017
Indicators value changes by year
Minimum:
23.081 bln
jan 1, 1973
Maximum:
69.79 bln
jan 1, 2008
At the date of observation
Value
Absolute change
Change from previous value
jan 1, 1973
23.081 bln
+23.081 bln
0.0%
jan 1, 1974
24.518 bln
+1.437 bln
6.23%
jan 1, 1975
24.325 bln
-193.211 mln
-0.79%
jan 1, 1976
24.267 bln
-57.249 mln
-0.24%
jan 1, 1977
25.969 bln
+1.701 bln
7.01%
jan 1, 1978
27.621 bln
+1.652 bln
6.36%
jan 1, 1979
28.527 bln
+905.679 mln
3.28%
jan 1, 1980
29.613 bln
+1.086 bln
3.81%
jan 1, 1981
29.666 bln
+53.215 mln
0.18%
jan 1, 1982
30.116 bln
+449.392 mln
1.51%
jan 1, 1983
29.829 bln
-286.951 mln
-0.95%
jan 1, 1984
30.768 bln
+939.621 mln
3.15%
jan 1, 1985
32.354 bln
+1.586 bln
5.15%
jan 1, 1986
33.886 bln
+1.532 bln
4.73%
jan 1, 1987
35.362 bln
+1.476 bln
4.36%
jan 1, 1988
37.418 bln
+2.057 bln
5.82%
jan 1, 1989
39.133 bln
+1.714 bln
4.58%
jan 1, 1990
40.14 bln
+1.008 bln
2.57%
jan 1, 1991
41.054 bln
+913.573 mln
2.28%
jan 1, 1992
40.629 bln
-425.011 mln
-1.04%
jan 1, 1993
41.851 bln
+1.222 bln
3.01%
jan 1, 1994
43.61 bln
+1.759 bln
4.2%
jan 1, 1995
45.397 bln
+1.786 bln
4.1%
jan 1, 1996
47.886 bln
+2.489 bln
5.48%
jan 1, 1997
50.731 bln
+2.845 bln
5.94%
jan 1, 1998
53.612 bln
+2.881 bln
5.68%
jan 1, 1999
55.731 bln
+2.12 bln
3.95%
jan 1, 2000
58.633 bln
+2.902 bln
5.21%
jan 1, 2001
59.504 bln
+871.512 mln
1.49%
jan 1, 2002
60.389 bln
+884.233 mln
1.49%
jan 1, 2003
63.018 bln
+2.629 bln
4.35%
jan 1, 2004
64.309 bln
+1.291 bln
2.05%
jan 1, 2005
66.614 bln
+2.304 bln
3.58%
jan 1, 2006
68.58 bln
+1.966 bln
2.95%
jan 1, 2007
69.111 bln
+531.69 mln
0.78%
jan 1, 2008
69.79 bln
+679.214 mln
0.98%
jan 1, 2009
68.571 bln
-1.22 bln
-1.75%
jan 1, 2010
67.193 bln
-1.377 bln
-2.01%
jan 1, 2011
67.626 bln
+432.337 mln
0.64%
jan 1, 2012
67.494 bln
-131.267 mln
-0.19%
jan 1, 2013
69.126 bln
+1.632 bln
2.42%
jan 1, 2014
67.716 bln
-1.41 bln
-2.04%
Ranking of countries by current statistics by years


Comments: