29
/
en
AIzaSyAYiBZKx7MnpbEhh9jyipgxe19OcubqV5w
April 1, 2024
110888
Congo, Rep.
COG
true
2
1
Final consumption expenditure (constant 2010 US$)
2016,2015,2014,2013,2012,2011,2010,2009,2008,2007,2006,2005,2004,2003,2002,2001,2000,1999,1998,1997,1996,1995,1994,1993,1992,1991,1990,1989,1988,1987,1986,1985,1984,1983,1982,1981,1980,1979,1978,1977,1976,1975,1974,1973,1972,1971,1970,1969,1968,1967,1966,1965,1964,1963,1962,1961
This statistics in other country:
AfghanistanAlbaniaAlgeriaAngolaAntigua and BarbudaArab WorldArgentinaArmeniaArubaAustraliaAustriaAzerbaijanBahamas, TheBahrainBangladeshBarbadosBelarusBelgiumBelizeBeninBermudaBhutanBoliviaBosnia and HerzegovinaBotswanaBrazilBrunei DarussalamBulgariaBurkina FasoBurundiCabo VerdeCambodiaCameroonCanadaCaribbean small statesCentral African RepublicCentral Europe and the BalticsChadChileChinaColombiaComorosCongo, Dem. Rep.Congo, Rep.Costa RicaCote d'IvoireCroatiaCubaCyprusCzech RepublicDenmarkDominicaDominican RepublicEarly-demographic dividendEast Asia & PacificEast Asia & Pacific (excluding high income)East Asia & Pacific (IDA & IBRD countries)EcuadorEgypt, Arab Rep.El SalvadorEquatorial GuineaEritreaEstoniaEuro areaEurope & Central AsiaEurope & Central Asia (excluding high income)Europe & Central Asia (IDA & IBRD countries)European UnionFaroe IslandsFinlandFranceGabonGambia, TheGeorgiaGermanyGhanaGreeceGrenadaGuatemalaGuineaGuinea-BissauGuyanaHaitiHeavily indebted poor countries (HIPC)High incomeHondurasHong Kong SAR, ChinaHungaryIBRD onlyIcelandIDA & IBRD totalIDA blendIDA onlyIDA totalIndiaIndonesiaIran, Islamic Rep.IrelandIsraelItalyJamaicaJapanJordanKazakhstanKenyaKorea, Rep.KosovoKuwaitKyrgyz RepublicLao PDRLate-demographic dividendLatin America & Caribbean Latin America & Caribbean (excluding high income)Latin America & the Caribbean (IDA & IBRD countries)LatviaLeast developed countries: UN classificationLebanonLiberiaLithuaniaLow & middle incomeLow incomeLower middle incomeLuxembourgMacao SAR, ChinaMacedonia, FYRMadagascarMalawiMalaysiaMaliMaltaMauritaniaMauritiusMexicoMiddle East & North AfricaMiddle East & North Africa (excluding high income)Middle East & North Africa (IDA & IBRD countries)Middle incomeMoldovaMongoliaMontenegroMoroccoMozambiqueNamibiaNepalNetherlandsNew ZealandNicaraguaNigerNigeriaNorth AmericaNorwayOECD membersOmanOther small statesPakistanPanamaParaguayPeruPhilippinesPolandPortugalPost-demographic dividendPre-demographic dividendPuerto RicoQatarRomaniaRussian FederationRwandaSaudi ArabiaSenegalSerbiaSeychellesSierra LeoneSingaporeSlovak RepublicSloveniaSmall statesSouth AfricaSouth AsiaSouth Asia (IDA & IBRD)South SudanSpainSri LankaSt. Kitts and NevisSt. LuciaSt. Vincent and the GrenadinesSub-Saharan Africa Sub-Saharan Africa (excluding high income)Sub-Saharan Africa (IDA & IBRD countries)SudanSurinameSwazilandSwedenSwitzerlandTajikistanTanzaniaThailandTimor-LesteTogoTongaTrinidad and TobagoTunisiaTurkeyUgandaUkraineUnited Arab EmiratesUnited KingdomUnited StatesUpper middle incomeUruguayUzbekistanVanuatuVenezuela, RBVietnamWest Bank and GazaWorldYemen, Rep.ZambiaZimbabwe Timeline:
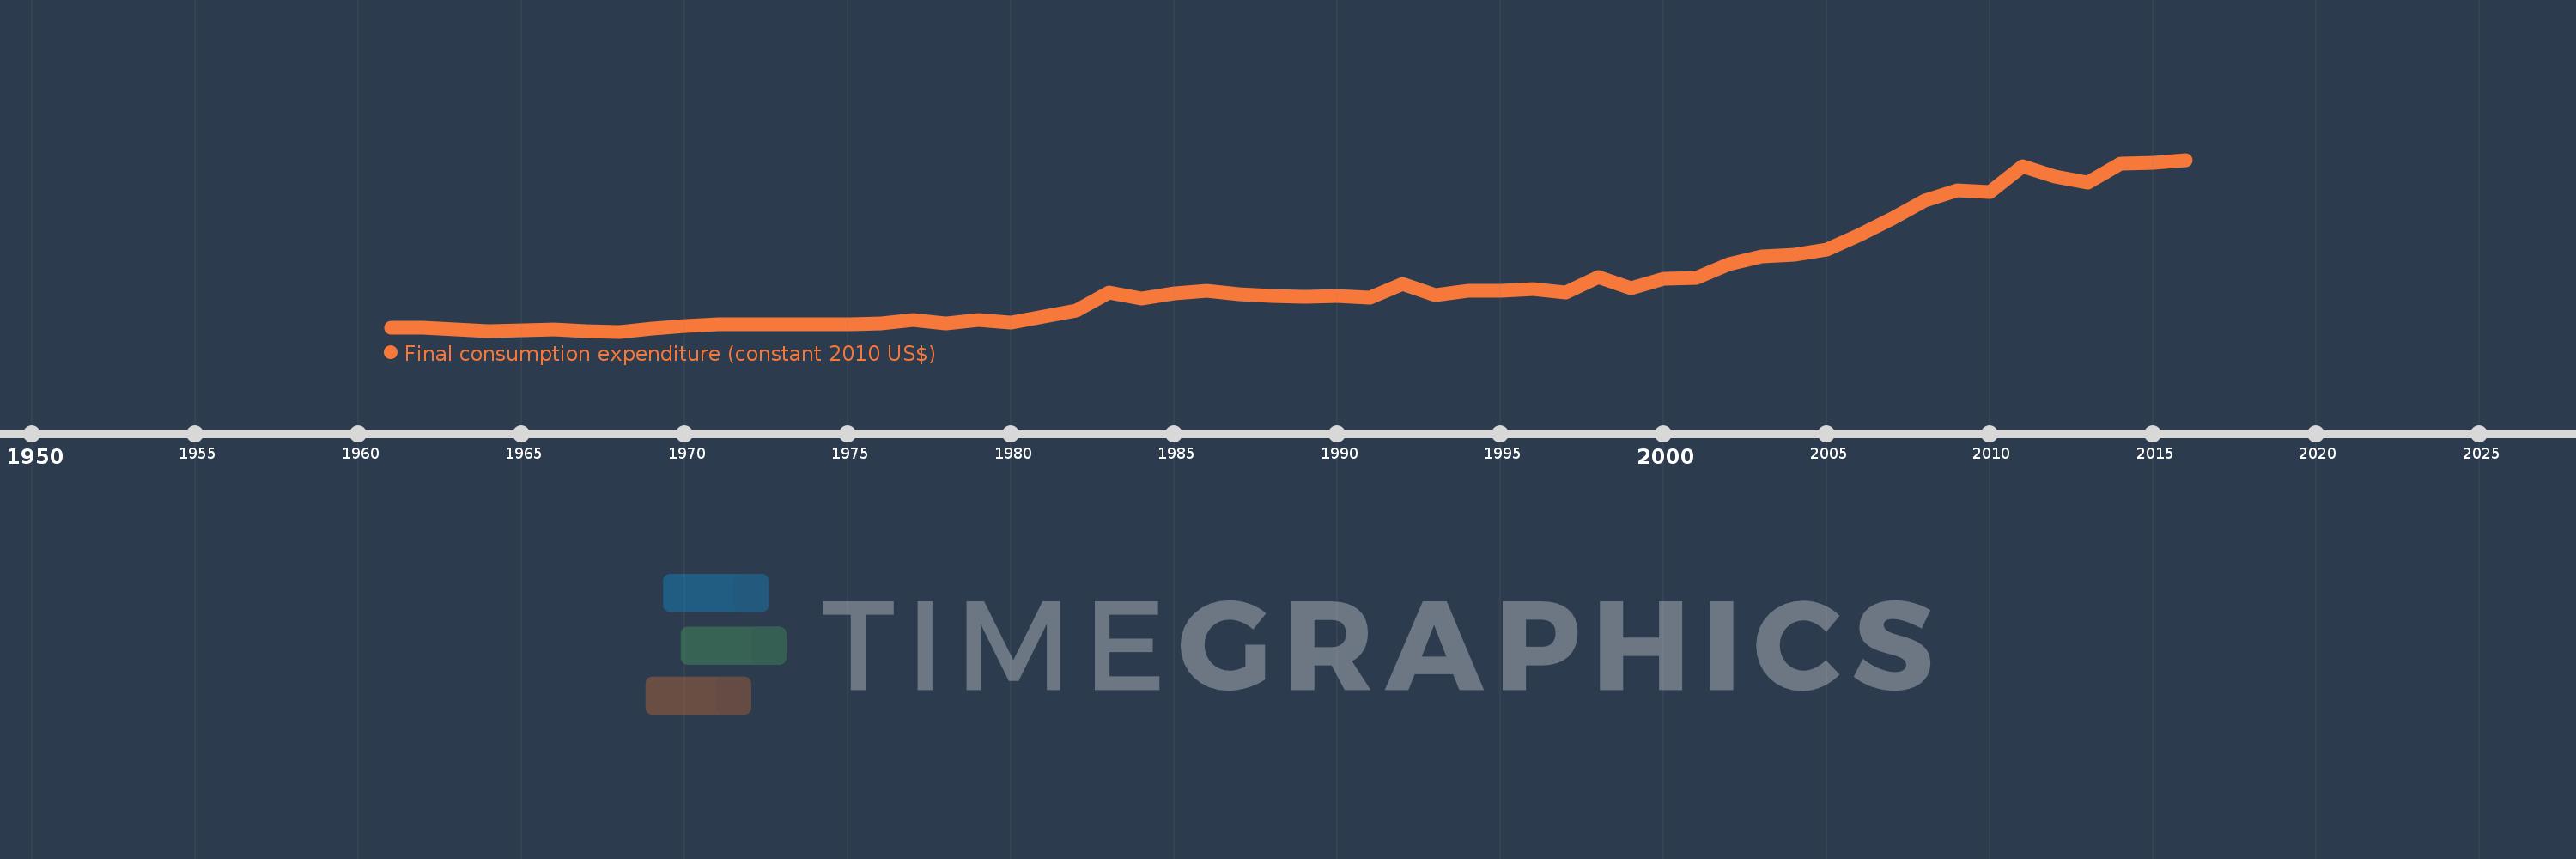
This timeline shows a graph from 1961 to 2016 of Congo, Rep.. No data until 1960. Number of actual observations by date: 56.
Source name:
World Development Indicators
Source organization:
World Bank national accounts data, and OECD National Accounts data files.
Categories, topics:
Economy & Growth
Last updated:
apr 23, 2017
Indicators value changes by year
Minimum:
703.59 mln
jan 1, 1968
Maximum:
6.093 bln
jan 1, 2016
At the date of observation
Value
Absolute change
Change from previous value
jan 1, 1961
833.314 mln
+833.314 mln
0.0%
jan 1, 1962
829.707 mln
-3.607 mln
-0.43%
jan 1, 1963
781.006 mln
-48.7 mln
-5.87%
jan 1, 1964
728.699 mln
-52.308 mln
-6.7%
jan 1, 1965
750.343 mln
+21.644 mln
2.97%
jan 1, 1966
757.558 mln
+7.215 mln
0.96%
jan 1, 1967
720.703 mln
-36.855 mln
-4.87%
jan 1, 1968
703.59 mln
-17.113 mln
-2.37%
jan 1, 1969
789.678 mln
+86.088 mln
12.24%
jan 1, 1970
870.966 mln
+81.288 mln
10.29%
jan 1, 1971
933.343 mln
+62.377 mln
7.16%
jan 1, 1972
936.288 mln
+2.946 mln
0.32%
jan 1, 1973
942.959 mln
+6.671 mln
0.71%
jan 1, 1974
942.162 mln
-797.419K
-0.08%
jan 1, 1975
932.22 mln
-9.942 mln
-1.06%
jan 1, 1976
956.714 mln
+24.494 mln
2.63%
jan 1, 1977
1.075 bln
+118.568 mln
12.39%
jan 1, 1978
969.395 mln
-105.887 mln
-9.85%
jan 1, 1979
1.073 bln
+104.054 mln
10.73%
jan 1, 1980
997.428 mln
-76.021 mln
-7.08%
jan 1, 1981
1.179 bln
+181.078 mln
18.15%
jan 1, 1982
1.359 bln
+180.492 mln
15.32%
jan 1, 1983
1.925 bln
+566.383 mln
41.68%
jan 1, 1984
1.742 bln
-183.808 mln
-9.55%
jan 1, 1985
1.893 bln
+151.545 mln
8.7%
jan 1, 1986
1.982 bln
+89.003 mln
4.7%
jan 1, 1987
1.876 bln
-106.395 mln
-5.37%
jan 1, 1988
1.812 bln
-64.136 mln
-3.42%
jan 1, 1989
1.799 bln
-12.22 mln
-0.67%
jan 1, 1990
1.828 bln
+28.192 mln
1.57%
jan 1, 1991
1.771 bln
-56.445 mln
-3.09%
jan 1, 1992
2.196 bln
+424.95 mln
23.99%
jan 1, 1993
1.841 bln
-355.316 mln
-16.18%
jan 1, 1994
1.971 bln
+130.068 mln
7.07%
jan 1, 1995
1.971 bln
-181.885K
-0.01%
jan 1, 1996
2.025 bln
+54.117 mln
2.75%
jan 1, 1997
1.934 bln
-90.358 mln
-4.46%
jan 1, 1998
2.418 bln
+483.34 mln
24.99%
jan 1, 1999
2.058 bln
-360.082 mln
-14.89%
jan 1, 2000
2.362 bln
+304.389 mln
14.79%
jan 1, 2001
2.382 bln
+20.002 mln
0.85%
jan 1, 2002
2.822 bln
+440.134 mln
18.48%
jan 1, 2003
3.068 bln
+245.937 mln
8.71%
jan 1, 2004
3.126 bln
+58.253 mln
1.9%
jan 1, 2005
3.275 bln
+148.334 mln
4.74%
jan 1, 2006
3.735 bln
+460.622 mln
14.07%
jan 1, 2007
4.234 bln
+498.457 mln
13.34%
jan 1, 2008
4.805 bln
+571.201 mln
13.49%
jan 1, 2009
5.146 bln
+341.371 mln
7.1%
jan 1, 2010
5.07 bln
-76.03 mln
-1.48%
jan 1, 2011
5.89 bln
+820.152 mln
16.18%
jan 1, 2012
5.581 bln
-309.899 mln
-5.26%
jan 1, 2013
5.388 bln
-192.453 mln
-3.45%
jan 1, 2014
5.983 bln
+595.202 mln
11.05%
jan 1, 2015
6.006 bln
+22.948 mln
0.38%
jan 1, 2016
6.093 bln
+86.39 mln
1.44%
Ranking of countries by current statistics by years


Comments: