29
/
en
AIzaSyAYiBZKx7MnpbEhh9jyipgxe19OcubqV5w
April 1, 2024
247501
Spain
ESP
true
2
1
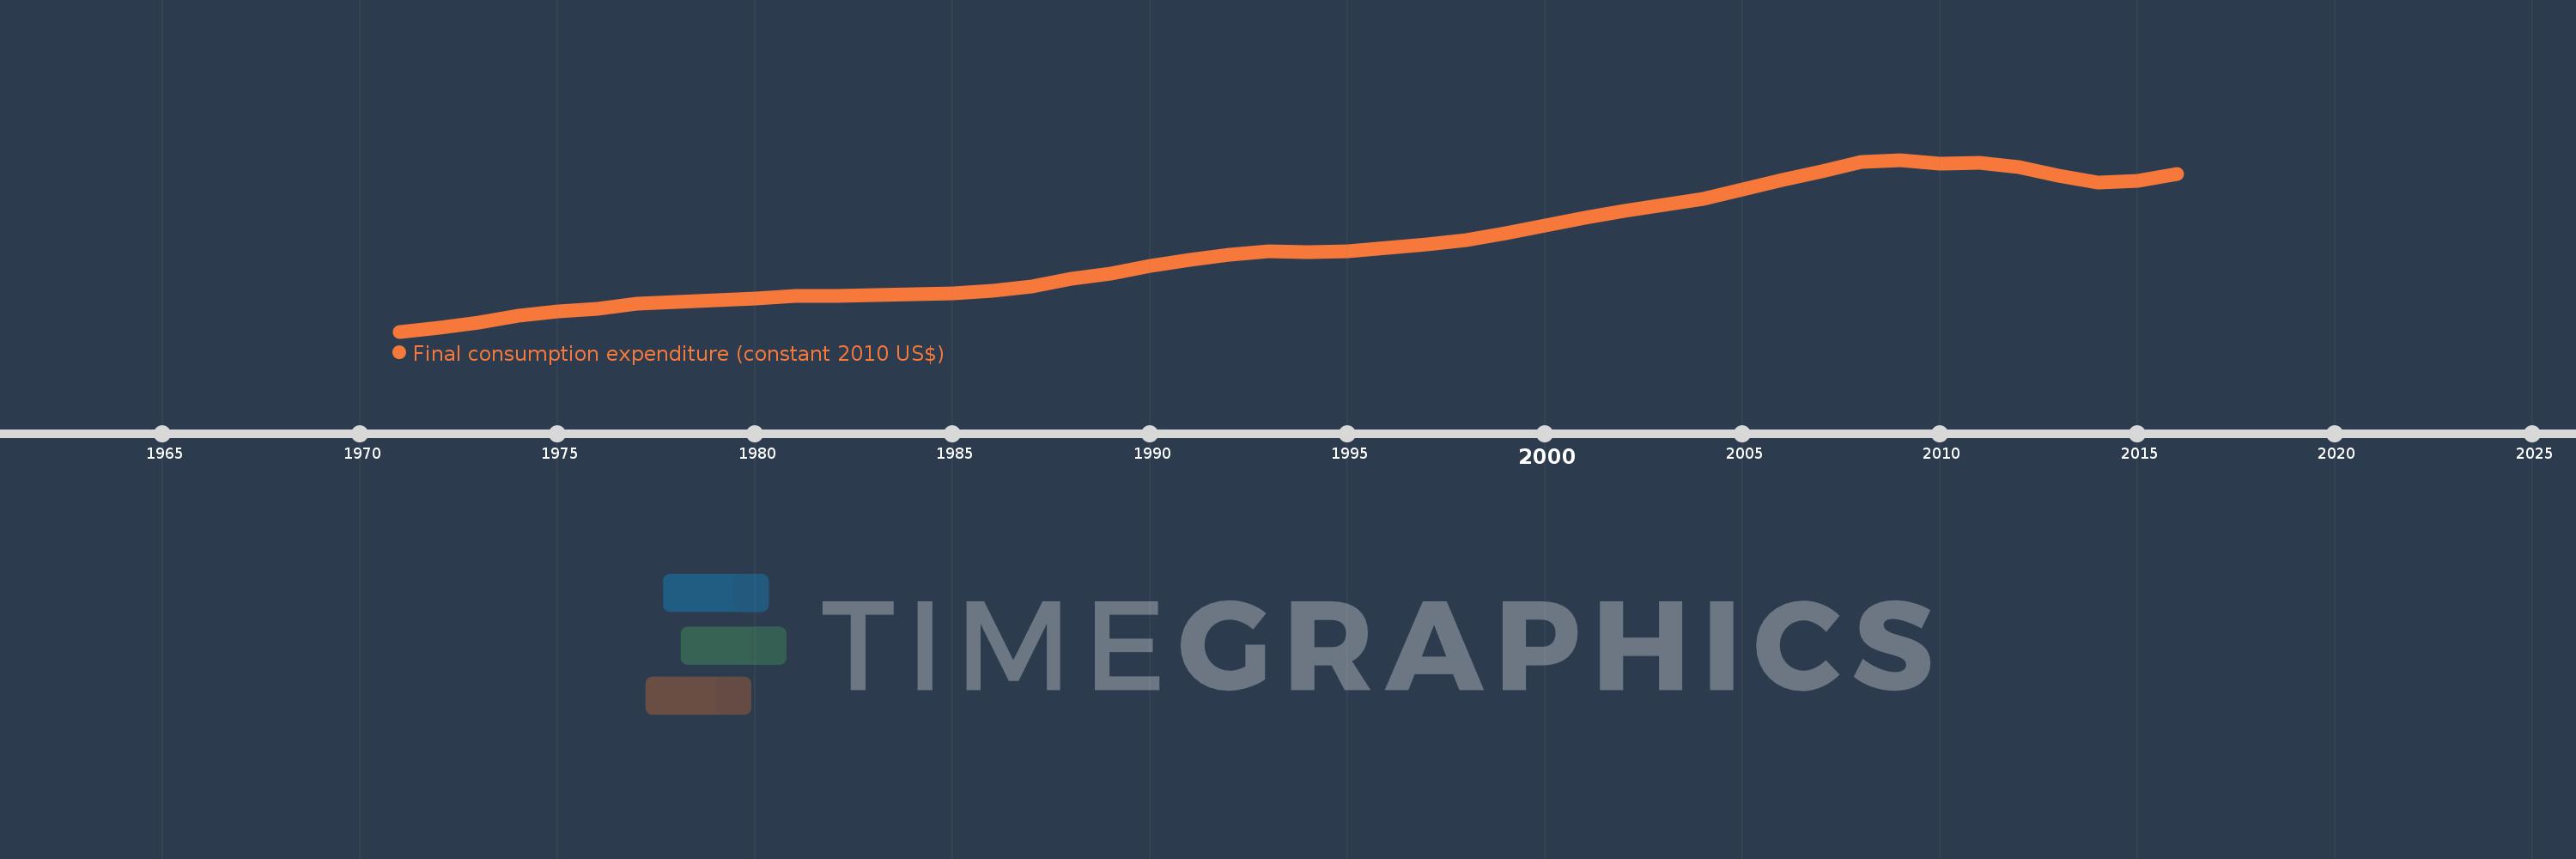
Final consumption expenditure (constant 2010 US$)
2016,2015,2014,2013,2012,2011,2010,2009,2008,2007,2006,2005,2004,2003,2002,2001,2000,1999,1998,1997,1996,1995,1994,1993,1992,1991,1990,1989,1988,1987,1986,1985,1984,1983,1982,1981,1980,1979,1978,1977,1976,1975,1974,1973,1972,1971
This statistics in other country:
AfghanistanAlbaniaAlgeriaAngolaAntigua and BarbudaArab WorldArgentinaArmeniaArubaAustraliaAustriaAzerbaijanBahamas, TheBahrainBangladeshBarbadosBelarusBelgiumBelizeBeninBermudaBhutanBoliviaBosnia and HerzegovinaBotswanaBrazilBrunei DarussalamBulgariaBurkina FasoBurundiCabo VerdeCambodiaCameroonCanadaCaribbean small statesCentral African RepublicCentral Europe and the BalticsChadChileChinaColombiaComorosCongo, Dem. Rep.Congo, Rep.Costa RicaCote d'IvoireCroatiaCubaCyprusCzech RepublicDenmarkDominicaDominican RepublicEarly-demographic dividendEast Asia & PacificEast Asia & Pacific (excluding high income)East Asia & Pacific (IDA & IBRD countries)EcuadorEgypt, Arab Rep.El SalvadorEquatorial GuineaEritreaEstoniaEuro areaEurope & Central AsiaEurope & Central Asia (excluding high income)Europe & Central Asia (IDA & IBRD countries)European UnionFaroe IslandsFinlandFranceGabonGambia, TheGeorgiaGermanyGhanaGreeceGrenadaGuatemalaGuineaGuinea-BissauGuyanaHaitiHeavily indebted poor countries (HIPC)High incomeHondurasHong Kong SAR, ChinaHungaryIBRD onlyIcelandIDA & IBRD totalIDA blendIDA onlyIDA totalIndiaIndonesiaIran, Islamic Rep.IrelandIsraelItalyJamaicaJapanJordanKazakhstanKenyaKorea, Rep.KosovoKuwaitKyrgyz RepublicLao PDRLate-demographic dividendLatin America & Caribbean Latin America & Caribbean (excluding high income)Latin America & the Caribbean (IDA & IBRD countries)LatviaLeast developed countries: UN classificationLebanonLiberiaLithuaniaLow & middle incomeLow incomeLower middle incomeLuxembourgMacao SAR, ChinaMacedonia, FYRMadagascarMalawiMalaysiaMaliMaltaMauritaniaMauritiusMexicoMiddle East & North AfricaMiddle East & North Africa (excluding high income)Middle East & North Africa (IDA & IBRD countries)Middle incomeMoldovaMongoliaMontenegroMoroccoMozambiqueNamibiaNepalNetherlandsNew ZealandNicaraguaNigerNigeriaNorth AmericaNorwayOECD membersOmanOther small statesPakistanPanamaParaguayPeruPhilippinesPolandPortugalPost-demographic dividendPre-demographic dividendPuerto RicoQatarRomaniaRussian FederationRwandaSaudi ArabiaSenegalSerbiaSeychellesSierra LeoneSingaporeSlovak RepublicSloveniaSmall statesSouth AfricaSouth AsiaSouth Asia (IDA & IBRD)South SudanSpainSri LankaSt. Kitts and NevisSt. LuciaSt. Vincent and the GrenadinesSub-Saharan Africa Sub-Saharan Africa (excluding high income)Sub-Saharan Africa (IDA & IBRD countries)SudanSurinameSwazilandSwedenSwitzerlandTajikistanTanzaniaThailandTimor-LesteTogoTongaTrinidad and TobagoTunisiaTurkeyUgandaUkraineUnited Arab EmiratesUnited KingdomUnited StatesUpper middle incomeUruguayUzbekistanVanuatuVenezuela, RBVietnamWest Bank and GazaWorldYemen, Rep.ZambiaZimbabwe Timeline:
This timeline shows a graph from 1971 to 2016 of Spain. No data until 1970. Number of actual observations by date: 46.
Source name:
World Development Indicators
Source organization:
World Bank national accounts data, and OECD National Accounts data files.
Categories, topics:
Economy & Growth
Last updated:
apr 23, 2017
Indicators value changes by year
Minimum:
329.388 bln
jan 1, 1971
Maximum:
1.126 trl
jan 1, 2009
At the date of observation
Value
Absolute change
Change from previous value
jan 1, 1971
329.388 bln
+329.388 bln
0.0%
jan 1, 1972
345.774 bln
+16.387 bln
4.97%
jan 1, 1973
372.799 bln
+27.024 bln
7.82%
jan 1, 1974
401.08 bln
+28.281 bln
7.59%
jan 1, 1975
424.075 bln
+22.995 bln
5.73%
jan 1, 1976
433.957 bln
+9.882 bln
2.33%
jan 1, 1977
459.163 bln
+25.206 bln
5.81%
jan 1, 1978
467.834 bln
+8.671 bln
1.89%
jan 1, 1979
475.522 bln
+7.688 bln
1.64%
jan 1, 1980
484.063 bln
+8.541 bln
1.8%
jan 1, 1981
495.272 bln
+11.209 bln
2.32%
jan 1, 1982
494.77 bln
-502.057 mln
-0.1%
jan 1, 1983
499.301 bln
+4.531 bln
0.92%
jan 1, 1984
503.979 bln
+4.678 bln
0.94%
jan 1, 1985
505.009 bln
+1.029 bln
0.2%
jan 1, 1986
518.606 bln
+13.598 bln
2.69%
jan 1, 1987
537.563 bln
+18.956 bln
3.66%
jan 1, 1988
573.093 bln
+35.531 bln
6.61%
jan 1, 1989
599.633 bln
+26.54 bln
4.63%
jan 1, 1990
635.779 bln
+36.146 bln
6.03%
jan 1, 1991
661.821 bln
+26.042 bln
4.1%
jan 1, 1992
685.434 bln
+23.613 bln
3.57%
jan 1, 1993
702.338 bln
+16.904 bln
2.47%
jan 1, 1994
696.143 bln
-6.195 bln
-0.88%
jan 1, 1995
702.807 bln
+6.663 bln
0.96%
jan 1, 1996
716.02 bln
+13.213 bln
1.88%
jan 1, 1997
731.625 bln
+15.605 bln
2.18%
jan 1, 1998
752.253 bln
+20.628 bln
2.82%
jan 1, 1999
783.932 bln
+31.679 bln
4.21%
jan 1, 2000
820.478 bln
+36.546 bln
4.66%
jan 1, 2001
857.562 bln
+37.083 bln
4.52%
jan 1, 2002
889.662 bln
+32.101 bln
3.74%
jan 1, 2003
918.086 bln
+28.424 bln
3.19%
jan 1, 2004
945.126 bln
+27.04 bln
2.95%
jan 1, 2005
988.147 bln
+43.021 bln
4.55%
jan 1, 2006
1.031 trl
+43.213 bln
4.37%
jan 1, 2007
1.073 trl
+41.96 bln
4.07%
jan 1, 2008
1.116 trl
+42.307 bln
3.94%
jan 1, 2009
1.126 trl
+10.089 bln
0.9%
jan 1, 2010
1.107 trl
-19.019 bln
-1.69%
jan 1, 2011
1.113 trl
+6.507 bln
0.59%
jan 1, 2012
1.093 trl
-20.143 bln
-1.81%
jan 1, 2013
1.052 trl
-41.265 bln
-3.78%
jan 1, 2014
1.02 trl
-31.525 bln
-3.0%
jan 1, 2015
1.029 trl
+8.742 bln
0.86%
jan 1, 2016
1.06 trl
+30.775 bln
2.99%
Ranking of countries by current statistics by years


Comments: