29
/
en
AIzaSyAYiBZKx7MnpbEhh9jyipgxe19OcubqV5w
April 1, 2024
205218
Namibia
NAM
true
2
1
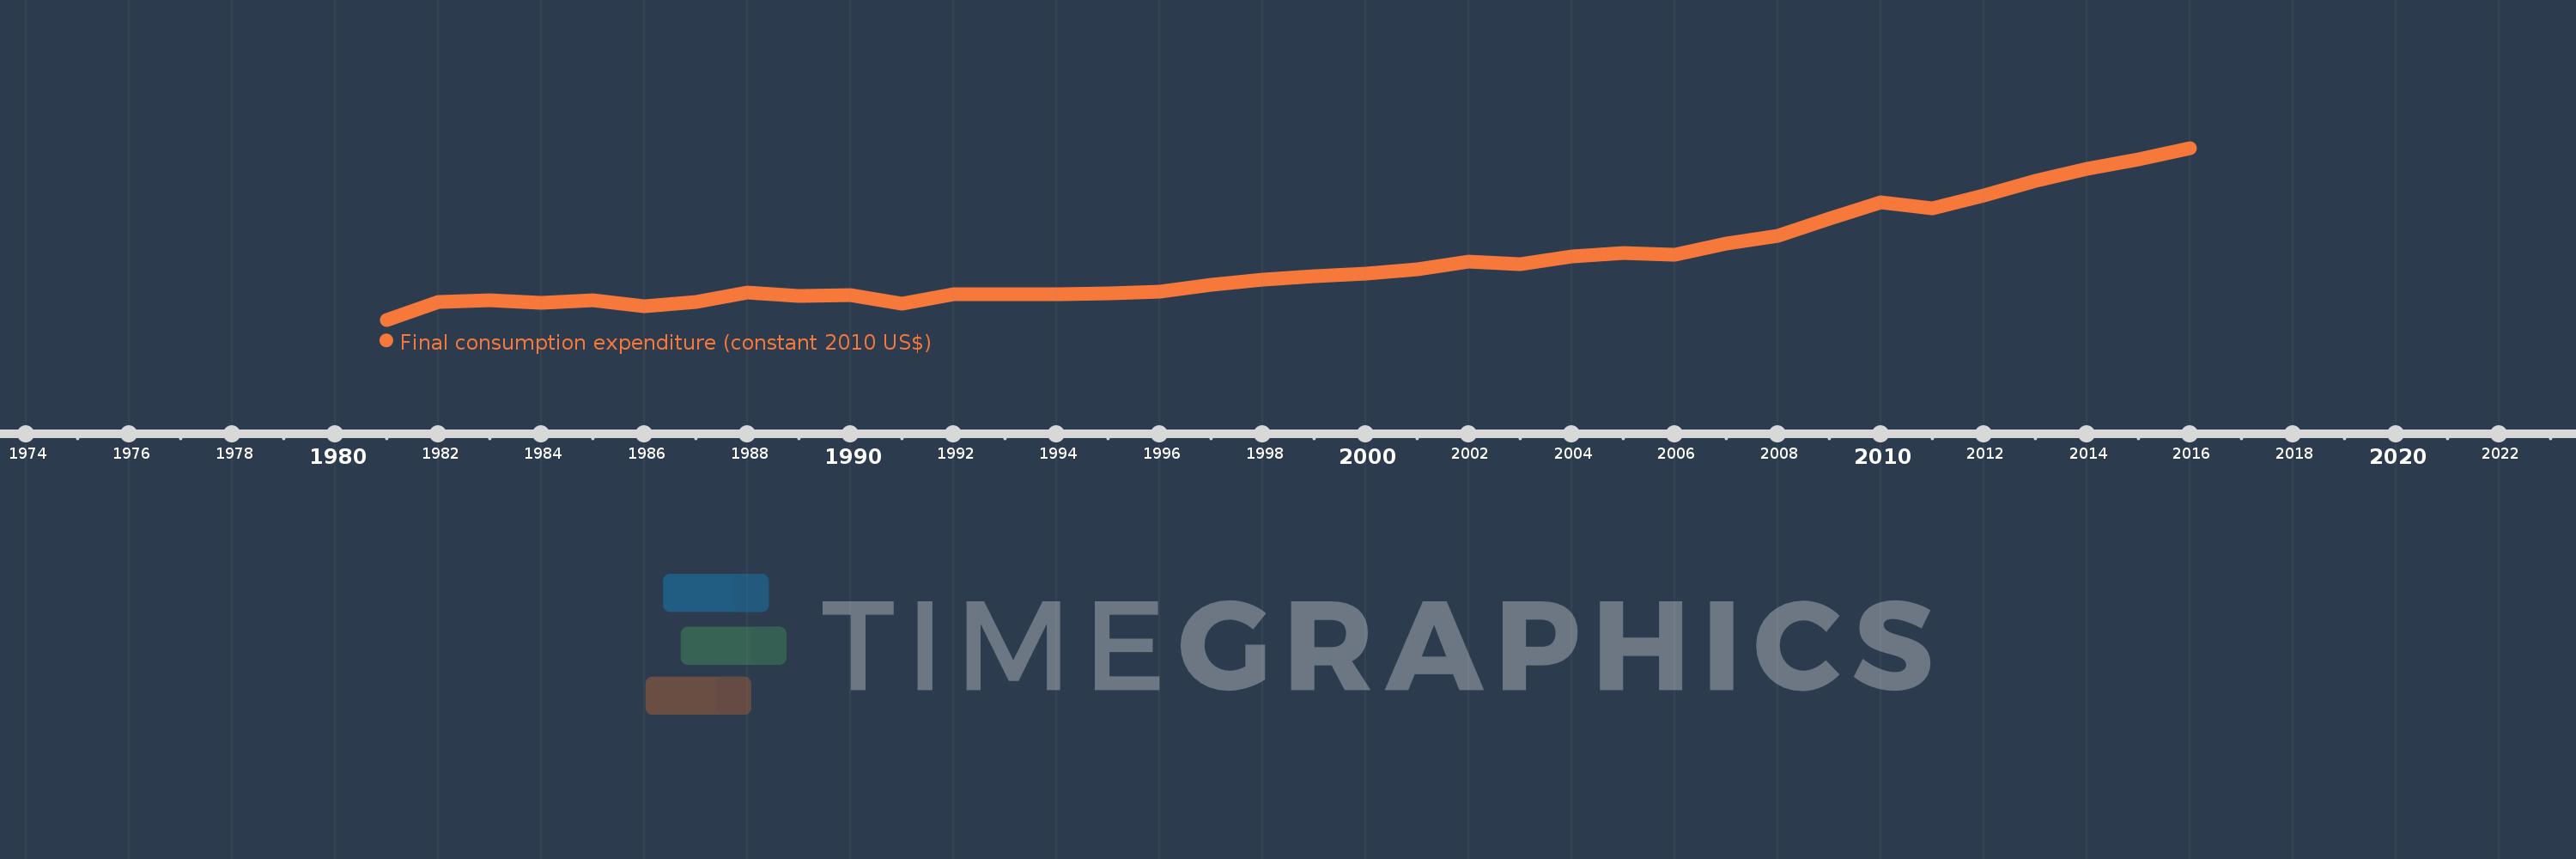
Final consumption expenditure (constant 2010 US$)
2016,2015,2014,2013,2012,2011,2010,2009,2008,2007,2006,2005,2004,2003,2002,2001,2000,1999,1998,1997,1996,1995,1994,1993,1992,1991,1990,1989,1988,1987,1986,1985,1984,1983,1982,1981
This statistics in other country:
AfghanistanAlbaniaAlgeriaAngolaAntigua and BarbudaArab WorldArgentinaArmeniaArubaAustraliaAustriaAzerbaijanBahamas, TheBahrainBangladeshBarbadosBelarusBelgiumBelizeBeninBermudaBhutanBoliviaBosnia and HerzegovinaBotswanaBrazilBrunei DarussalamBulgariaBurkina FasoBurundiCabo VerdeCambodiaCameroonCanadaCaribbean small statesCentral African RepublicCentral Europe and the BalticsChadChileChinaColombiaComorosCongo, Dem. Rep.Congo, Rep.Costa RicaCote d'IvoireCroatiaCubaCyprusCzech RepublicDenmarkDominicaDominican RepublicEarly-demographic dividendEast Asia & PacificEast Asia & Pacific (excluding high income)East Asia & Pacific (IDA & IBRD countries)EcuadorEgypt, Arab Rep.El SalvadorEquatorial GuineaEritreaEstoniaEuro areaEurope & Central AsiaEurope & Central Asia (excluding high income)Europe & Central Asia (IDA & IBRD countries)European UnionFaroe IslandsFinlandFranceGabonGambia, TheGeorgiaGermanyGhanaGreeceGrenadaGuatemalaGuineaGuinea-BissauGuyanaHaitiHeavily indebted poor countries (HIPC)High incomeHondurasHong Kong SAR, ChinaHungaryIBRD onlyIcelandIDA & IBRD totalIDA blendIDA onlyIDA totalIndiaIndonesiaIran, Islamic Rep.IrelandIsraelItalyJamaicaJapanJordanKazakhstanKenyaKorea, Rep.KosovoKuwaitKyrgyz RepublicLao PDRLate-demographic dividendLatin America & Caribbean Latin America & Caribbean (excluding high income)Latin America & the Caribbean (IDA & IBRD countries)LatviaLeast developed countries: UN classificationLebanonLiberiaLithuaniaLow & middle incomeLow incomeLower middle incomeLuxembourgMacao SAR, ChinaMacedonia, FYRMadagascarMalawiMalaysiaMaliMaltaMauritaniaMauritiusMexicoMiddle East & North AfricaMiddle East & North Africa (excluding high income)Middle East & North Africa (IDA & IBRD countries)Middle incomeMoldovaMongoliaMontenegroMoroccoMozambiqueNamibiaNepalNetherlandsNew ZealandNicaraguaNigerNigeriaNorth AmericaNorwayOECD membersOmanOther small statesPakistanPanamaParaguayPeruPhilippinesPolandPortugalPost-demographic dividendPre-demographic dividendPuerto RicoQatarRomaniaRussian FederationRwandaSaudi ArabiaSenegalSerbiaSeychellesSierra LeoneSingaporeSlovak RepublicSloveniaSmall statesSouth AfricaSouth AsiaSouth Asia (IDA & IBRD)South SudanSpainSri LankaSt. Kitts and NevisSt. LuciaSt. Vincent and the GrenadinesSub-Saharan Africa Sub-Saharan Africa (excluding high income)Sub-Saharan Africa (IDA & IBRD countries)SudanSurinameSwazilandSwedenSwitzerlandTajikistanTanzaniaThailandTimor-LesteTogoTongaTrinidad and TobagoTunisiaTurkeyUgandaUkraineUnited Arab EmiratesUnited KingdomUnited StatesUpper middle incomeUruguayUzbekistanVanuatuVenezuela, RBVietnamWest Bank and GazaWorldYemen, Rep.ZambiaZimbabwe Timeline:
This timeline shows a graph from 1981 to 2016 of Namibia. No data until 1980. Number of actual observations by date: 36.
Source name:
World Development Indicators
Source organization:
World Bank national accounts data, and OECD National Accounts data files.
Categories, topics:
Economy & Growth
Last updated:
apr 23, 2017
Indicators value changes by year
Minimum:
3.222 bln
jan 1, 1981
Maximum:
13.721 bln
jan 1, 2016
At the date of observation
Value
Absolute change
Change from previous value
jan 1, 1981
3.222 bln
+3.222 bln
0.0%
jan 1, 1982
4.312 bln
+1.091 bln
33.85%
jan 1, 1983
4.408 bln
+96.012 mln
2.23%
jan 1, 1984
4.265 bln
-143.547 mln
-3.26%
jan 1, 1985
4.4 bln
+135.608 mln
3.18%
jan 1, 1986
4.035 bln
-364.948 mln
-8.29%
jan 1, 1987
4.287 bln
+251.582 mln
6.23%
jan 1, 1988
4.868 bln
+580.982 mln
13.55%
jan 1, 1989
4.678 bln
-189.439 mln
-3.89%
jan 1, 1990
4.752 bln
+73.618 mln
1.57%
jan 1, 1991
4.206 bln
-545.57 mln
-11.48%
jan 1, 1992
4.783 bln
+577.0 mln
13.72%
jan 1, 1993
4.763 bln
-20.146 mln
-0.42%
jan 1, 1994
4.767 bln
+3.802 mln
0.08%
jan 1, 1995
4.811 bln
+44.12 mln
0.93%
jan 1, 1996
4.952 bln
+141.231 mln
2.94%
jan 1, 1997
5.353 bln
+400.391 mln
8.08%
jan 1, 1998
5.697 bln
+343.762 mln
6.42%
jan 1, 1999
5.895 bln
+198.664 mln
3.49%
jan 1, 2000
6.029 bln
+134.069 mln
2.27%
jan 1, 2001
6.296 bln
+267.078 mln
4.43%
jan 1, 2002
6.751 bln
+454.146 mln
7.21%
jan 1, 2003
6.631 bln
-119.956 mln
-1.78%
jan 1, 2004
7.086 bln
+454.967 mln
6.86%
jan 1, 2005
7.279 bln
+193.346 mln
2.73%
jan 1, 2006
7.202 bln
-77.131 mln
-1.06%
jan 1, 2007
7.871 bln
+669.458 mln
9.3%
jan 1, 2008
8.37 bln
+499.121 mln
6.34%
jan 1, 2009
9.377 bln
+1.007 bln
12.03%
jan 1, 2010
10.404 bln
+1.027 bln
10.96%
jan 1, 2011
10.016 bln
-388.652 mln
-3.74%
jan 1, 2012
10.841 bln
+825.412 mln
8.24%
jan 1, 2013
11.687 bln
+845.631 mln
7.8%
jan 1, 2014
12.467 bln
+780.555 mln
6.68%
jan 1, 2015
12.998 bln
+531.061 mln
4.26%
jan 1, 2016
13.721 bln
+722.923 mln
5.56%
Ranking of countries by current statistics by years


Comments: