29
/
en
AIzaSyAYiBZKx7MnpbEhh9jyipgxe19OcubqV5w
April 1, 2024
248665
Sri Lanka
LKA
true
2
1
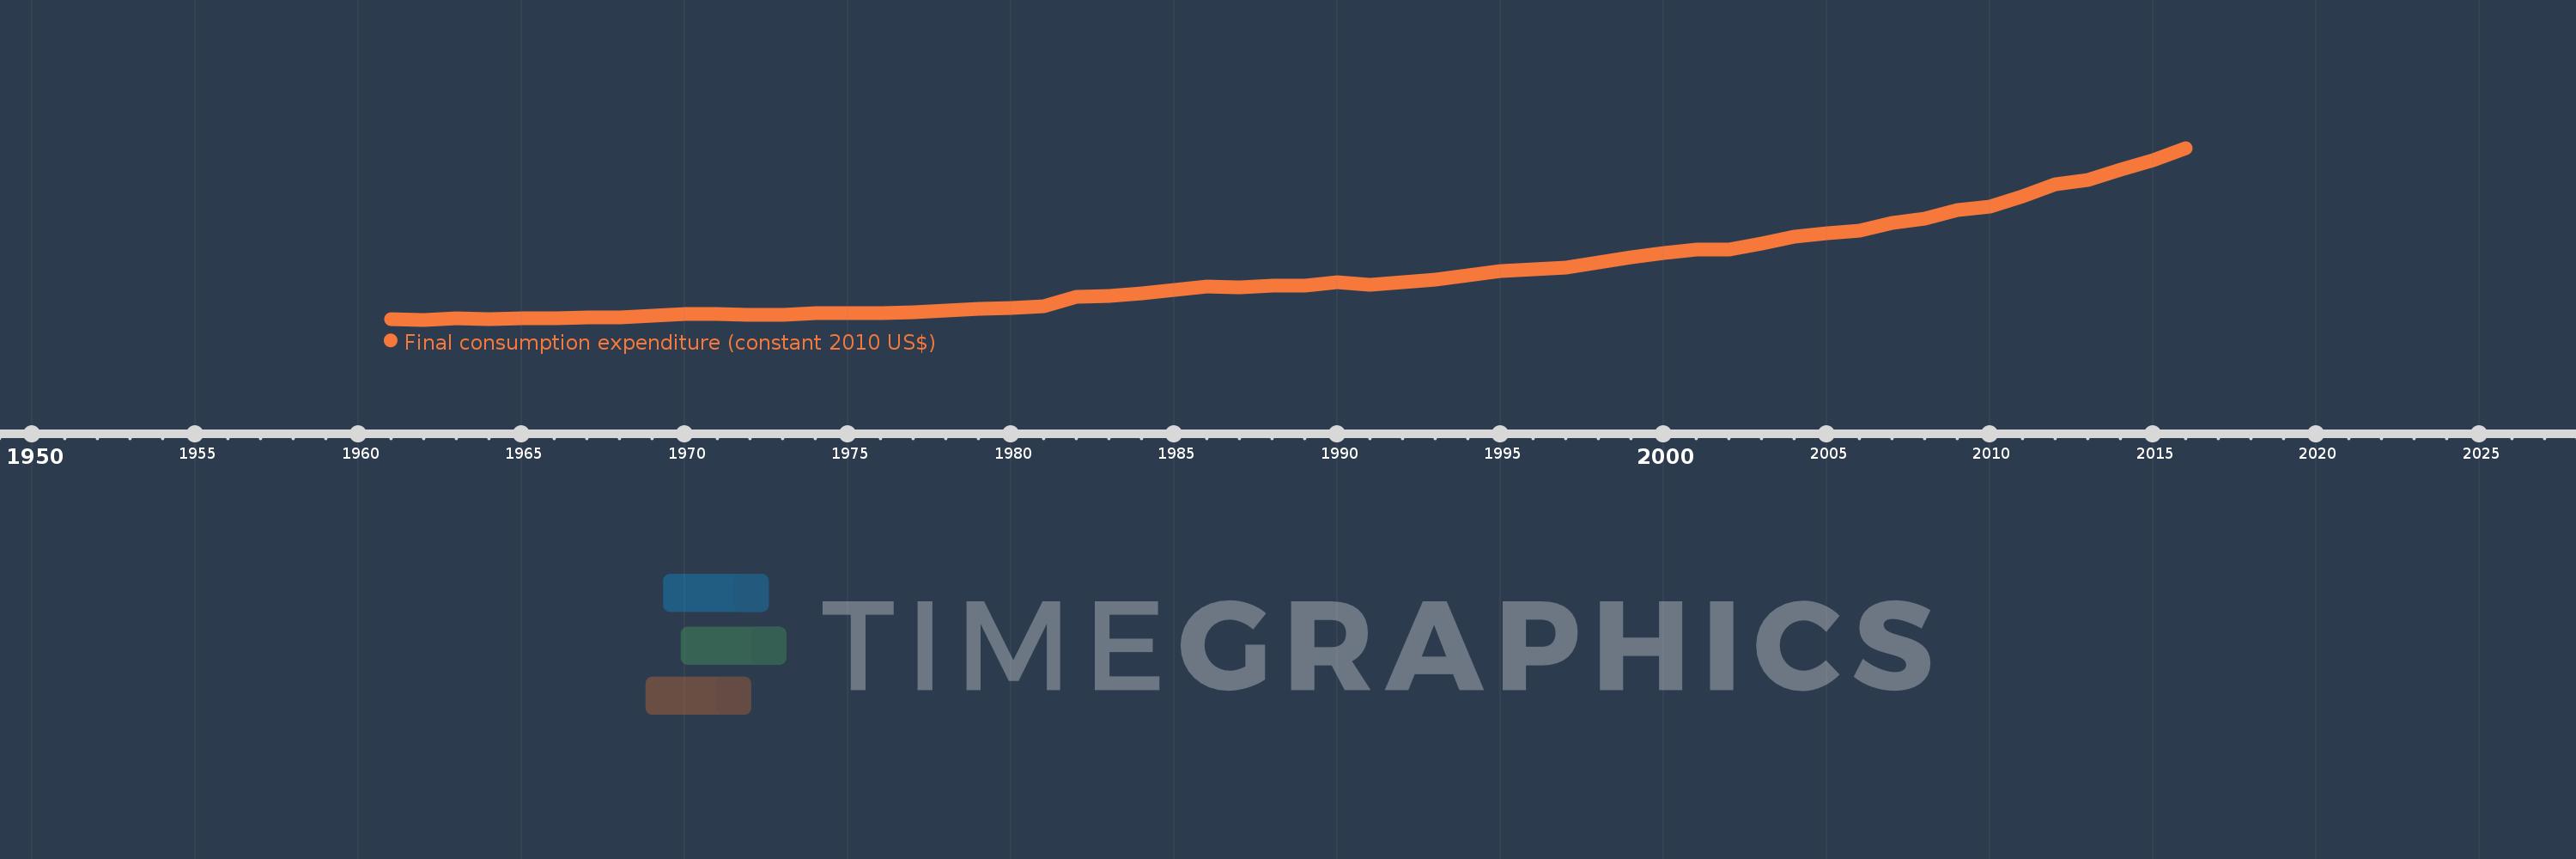
Final consumption expenditure (constant 2010 US$)
2016,2015,2014,2013,2012,2011,2010,2009,2008,2007,2006,2005,2004,2003,2002,2001,2000,1999,1998,1997,1996,1995,1994,1993,1992,1991,1990,1989,1988,1987,1986,1985,1984,1983,1982,1981,1980,1979,1978,1977,1976,1975,1974,1973,1972,1971,1970,1969,1968,1967,1966,1965,1964,1963,1962,1961
This statistics in other country:
AfghanistanAlbaniaAlgeriaAngolaAntigua and BarbudaArab WorldArgentinaArmeniaArubaAustraliaAustriaAzerbaijanBahamas, TheBahrainBangladeshBarbadosBelarusBelgiumBelizeBeninBermudaBhutanBoliviaBosnia and HerzegovinaBotswanaBrazilBrunei DarussalamBulgariaBurkina FasoBurundiCabo VerdeCambodiaCameroonCanadaCaribbean small statesCentral African RepublicCentral Europe and the BalticsChadChileChinaColombiaComorosCongo, Dem. Rep.Congo, Rep.Costa RicaCote d'IvoireCroatiaCubaCyprusCzech RepublicDenmarkDominicaDominican RepublicEarly-demographic dividendEast Asia & PacificEast Asia & Pacific (excluding high income)East Asia & Pacific (IDA & IBRD countries)EcuadorEgypt, Arab Rep.El SalvadorEquatorial GuineaEritreaEstoniaEuro areaEurope & Central AsiaEurope & Central Asia (excluding high income)Europe & Central Asia (IDA & IBRD countries)European UnionFaroe IslandsFinlandFranceGabonGambia, TheGeorgiaGermanyGhanaGreeceGrenadaGuatemalaGuineaGuinea-BissauGuyanaHaitiHeavily indebted poor countries (HIPC)High incomeHondurasHong Kong SAR, ChinaHungaryIBRD onlyIcelandIDA & IBRD totalIDA blendIDA onlyIDA totalIndiaIndonesiaIran, Islamic Rep.IrelandIsraelItalyJamaicaJapanJordanKazakhstanKenyaKorea, Rep.KosovoKuwaitKyrgyz RepublicLao PDRLate-demographic dividendLatin America & Caribbean Latin America & Caribbean (excluding high income)Latin America & the Caribbean (IDA & IBRD countries)LatviaLeast developed countries: UN classificationLebanonLiberiaLithuaniaLow & middle incomeLow incomeLower middle incomeLuxembourgMacao SAR, ChinaMacedonia, FYRMadagascarMalawiMalaysiaMaliMaltaMauritaniaMauritiusMexicoMiddle East & North AfricaMiddle East & North Africa (excluding high income)Middle East & North Africa (IDA & IBRD countries)Middle incomeMoldovaMongoliaMontenegroMoroccoMozambiqueNamibiaNepalNetherlandsNew ZealandNicaraguaNigerNigeriaNorth AmericaNorwayOECD membersOmanOther small statesPakistanPanamaParaguayPeruPhilippinesPolandPortugalPost-demographic dividendPre-demographic dividendPuerto RicoQatarRomaniaRussian FederationRwandaSaudi ArabiaSenegalSerbiaSeychellesSierra LeoneSingaporeSlovak RepublicSloveniaSmall statesSouth AfricaSouth AsiaSouth Asia (IDA & IBRD)South SudanSpainSri LankaSt. Kitts and NevisSt. LuciaSt. Vincent and the GrenadinesSub-Saharan Africa Sub-Saharan Africa (excluding high income)Sub-Saharan Africa (IDA & IBRD countries)SudanSurinameSwazilandSwedenSwitzerlandTajikistanTanzaniaThailandTimor-LesteTogoTongaTrinidad and TobagoTunisiaTurkeyUgandaUkraineUnited Arab EmiratesUnited KingdomUnited StatesUpper middle incomeUruguayUzbekistanVanuatuVenezuela, RBVietnamWest Bank and GazaWorldYemen, Rep.ZambiaZimbabwe Timeline:
This timeline shows a graph from 1961 to 2016 of Sri Lanka. No data until 1960. Number of actual observations by date: 56.
Source name:
World Development Indicators
Source organization:
World Bank national accounts data, and OECD National Accounts data files.
Categories, topics:
Economy & Growth
Last updated:
apr 23, 2017
Indicators value changes by year
Minimum:
4.572 bln
jan 1, 1962
Maximum:
58.78 bln
jan 1, 2016
At the date of observation
Value
Absolute change
Change from previous value
jan 1, 1961
4.823 bln
+4.823 bln
0.0%
jan 1, 1962
4.572 bln
-250.386 mln
-5.19%
jan 1, 1963
4.96 bln
+387.954 mln
8.48%
jan 1, 1964
4.749 bln
-211.323 mln
-4.26%
jan 1, 1965
4.98 bln
+231.218 mln
4.87%
jan 1, 1966
4.968 bln
-11.897 mln
-0.24%
jan 1, 1967
5.398 bln
+429.533 mln
8.65%
jan 1, 1968
5.438 bln
+40.441 mln
0.75%
jan 1, 1969
5.943 bln
+504.912 mln
9.28%
jan 1, 1970
6.437 bln
+494.259 mln
8.32%
jan 1, 1971
6.281 bln
-156.725 mln
-2.43%
jan 1, 1972
6.25 bln
-31.074 mln
-0.49%
jan 1, 1973
5.996 bln
-253.265 mln
-4.05%
jan 1, 1974
6.568 bln
+572.111 mln
9.54%
jan 1, 1975
6.615 bln
+46.102 mln
0.7%
jan 1, 1976
6.735 bln
+120.655 mln
1.82%
jan 1, 1977
6.923 bln
+187.783 mln
2.79%
jan 1, 1978
7.526 bln
+603.054 mln
8.71%
jan 1, 1979
8.015 bln
+488.893 mln
6.5%
jan 1, 1980
8.186 bln
+170.635 mln
2.13%
jan 1, 1981
8.743 bln
+557.297 mln
6.81%
jan 1, 1982
11.776 bln
+3.033 bln
34.69%
jan 1, 1983
12.14 bln
+363.727 mln
3.09%
jan 1, 1984
12.912 bln
+772.145 mln
6.36%
jan 1, 1985
14.035 bln
+1.123 bln
8.7%
jan 1, 1986
14.932 bln
+897.123 mln
6.39%
jan 1, 1987
14.769 bln
-162.506 mln
-1.09%
jan 1, 1988
15.265 bln
+495.846 mln
3.36%
jan 1, 1989
15.456 bln
+190.309 mln
1.25%
jan 1, 1990
16.396 bln
+940.889 mln
6.09%
jan 1, 1991
15.48 bln
-916.066 mln
-5.59%
jan 1, 1992
16.538 bln
+1.058 bln
6.83%
jan 1, 1993
17.364 bln
+825.849 mln
4.99%
jan 1, 1994
18.605 bln
+1.241 bln
7.15%
jan 1, 1995
19.927 bln
+1.322 bln
7.1%
jan 1, 1996
20.53 bln
+603.435 mln
3.03%
jan 1, 1997
21.091 bln
+560.654 mln
2.73%
jan 1, 1998
22.588 bln
+1.497 bln
7.1%
jan 1, 1999
24.192 bln
+1.605 bln
7.1%
jan 1, 2000
25.521 bln
+1.328 bln
5.49%
jan 1, 2001
26.73 bln
+1.209 bln
4.74%
jan 1, 2002
26.815 bln
+85.534 mln
0.32%
jan 1, 2003
28.495 bln
+1.68 bln
6.27%
jan 1, 2004
30.774 bln
+2.279 bln
8.0%
jan 1, 2005
31.93 bln
+1.156 bln
3.76%
jan 1, 2006
32.749 bln
+818.496 mln
2.56%
jan 1, 2007
34.989 bln
+2.241 bln
6.84%
jan 1, 2008
36.487 bln
+1.498 bln
4.28%
jan 1, 2009
39.312 bln
+2.825 bln
7.74%
jan 1, 2010
40.294 bln
+981.828 mln
2.5%
jan 1, 2011
43.626 bln
+3.332 bln
8.27%
jan 1, 2012
47.366 bln
+3.74 bln
8.57%
jan 1, 2013
48.611 bln
+1.244 bln
2.63%
jan 1, 2014
52.016 bln
+3.405 bln
7.01%
jan 1, 2015
54.984 bln
+2.967 bln
5.7%
jan 1, 2016
58.78 bln
+3.796 bln
6.9%
Ranking of countries by current statistics by years


Comments: