29
/
en
AIzaSyAYiBZKx7MnpbEhh9jyipgxe19OcubqV5w
April 1, 2024
76950
Bahrain
BHR
true
2
1
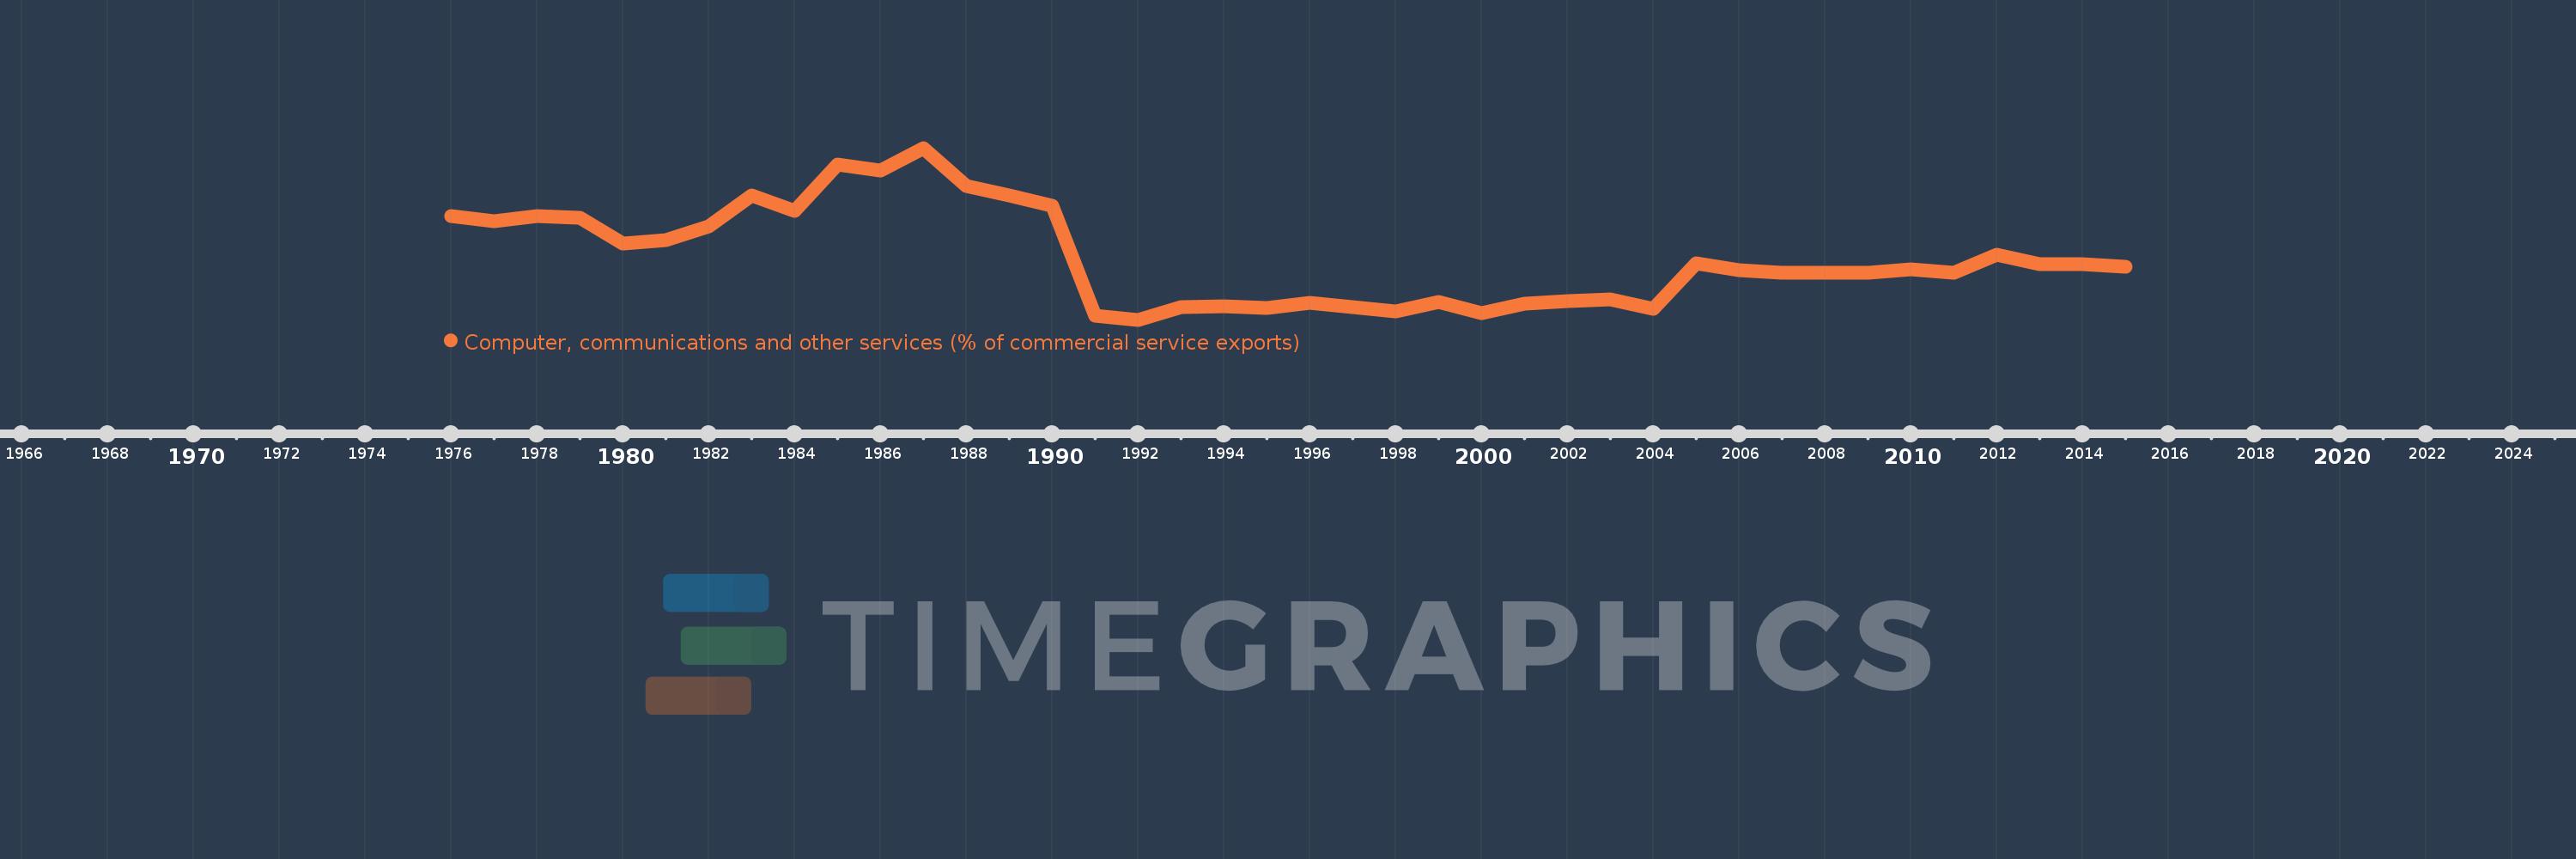
Computer, communications and other services (% of commercial service exports)
2015,2014,2013,2012,2011,2010,2009,2008,2007,2006,2005,2004,2003,2002,2001,2000,1999,1998,1997,1996,1995,1994,1993,1992,1991,1990,1989,1988,1987,1986,1985,1984,1983,1982,1981,1980,1979,1978,1977,1976
This statistics in other country:
AfghanistanAlbaniaAlgeriaAngolaAntigua and BarbudaArab WorldArgentinaArmeniaArubaAustraliaAustriaAzerbaijanBahamas, TheBahrainBangladeshBarbadosBelarusBelgiumBelizeBeninBermudaBhutanBoliviaBosnia and HerzegovinaBotswanaBrazilBrunei DarussalamBulgariaBurkina FasoBurundiCabo VerdeCambodiaCameroonCanadaCaribbean small statesCentral African RepublicCentral Europe and the BalticsChadChileChinaColombiaComorosCongo, Dem. Rep.Congo, Rep.Costa RicaCote d'IvoireCroatiaCuracaoCyprusCzech RepublicDenmarkDjiboutiDominicaDominican RepublicEarly-demographic dividendEast Asia & PacificEast Asia & Pacific (excluding high income)East Asia & Pacific (IDA & IBRD countries)EcuadorEgypt, Arab Rep.El SalvadorEritreaEstoniaEthiopiaEuro areaEurope & Central AsiaEurope & Central Asia (excluding high income)Europe & Central Asia (IDA & IBRD countries)European UnionFaroe IslandsFijiFinlandFragile and conflict affected situationsFranceFrench PolynesiaGabonGambia, TheGeorgiaGermanyGhanaGreeceGrenadaGuatemalaGuineaGuinea-BissauGuyanaHaitiHeavily indebted poor countries (HIPC)High incomeHondurasHong Kong SAR, ChinaHungaryIBRD onlyIcelandIDA & IBRD totalIDA onlyIDA totalIndiaIndonesiaIran, Islamic Rep.IraqIrelandIsraelItalyJamaicaJapanJordanKazakhstanKenyaKiribatiKorea, Rep.KosovoKuwaitKyrgyz RepublicLao PDRLate-demographic dividendLatin America & Caribbean Latin America & Caribbean (excluding high income)Latin America & the Caribbean (IDA & IBRD countries)LatviaLeast developed countries: UN classificationLebanonLesothoLiberiaLibyaLithuaniaLow & middle incomeLow incomeLower middle incomeLuxembourgMacao SAR, ChinaMacedonia, FYRMadagascarMalawiMalaysiaMaldivesMaliMaltaMarshall IslandsMauritaniaMauritiusMexicoMicronesia, Fed. Sts.Middle East & North AfricaMiddle East & North Africa (excluding high income)Middle East & North Africa (IDA & IBRD countries)Middle incomeMoldovaMongoliaMontenegroMoroccoMozambiqueMyanmarNamibiaNepalNetherlandsNew CaledoniaNew ZealandNicaraguaNigerNigeriaNorth AmericaNorwayOECD membersOmanOther small statesPacific island small statesPakistanPalauPanamaPapua New GuineaParaguayPeruPhilippinesPolandPortugalPost-demographic dividendPre-demographic dividendQatarRomaniaRussian FederationRwandaSamoaSao Tome and PrincipeSaudi ArabiaSenegalSerbiaSeychellesSierra LeoneSingaporeSint Maarten (Dutch part)Slovak RepublicSloveniaSmall statesSolomon IslandsSouth AfricaSouth AsiaSouth Asia (IDA & IBRD)South SudanSpainSri LankaSt. Kitts and NevisSt. LuciaSt. Vincent and the GrenadinesSub-Saharan Africa Sub-Saharan Africa (excluding high income)Sub-Saharan Africa (IDA & IBRD countries)SudanSurinameSwazilandSwedenSwitzerlandSyrian Arab RepublicTajikistanTanzaniaThailandTimor-LesteTogoTongaTrinidad and TobagoTunisiaTurkeyTuvaluUgandaUkraineUnited KingdomUnited StatesUpper middle incomeUruguayVanuatuVenezuela, RBWest Bank and GazaWorldYemen, Rep.ZambiaZimbabwe Timeline:
This timeline shows a graph from 1976 to 2015 of Bahrain. No data until 1975. Number of actual observations by date: 40.
Source name:
World Development Indicators
Source organization:
International Monetary Fund, Balance of Payments Statistics Yearbook and data files.
Categories, topics:
Private Sector, Trade
Last updated:
apr 23, 2017
Indicators value changes by year
Maximum:
85.782
jan 1, 1987
At the date of observation
Value
Absolute change
Change from previous value
jan 1, 1976
53.783
+53.783
0.0%
jan 1, 1977
51.465
-2.318
-4.31%
jan 1, 1978
53.761
+2.296
4.46%
jan 1, 1979
53.085
-0.677
-1.26%
jan 1, 1980
40.909
-12.176
-22.94%
jan 1, 1981
42.484
+1.575
3.85%
jan 1, 1982
49.274
+6.791
15.98%
jan 1, 1983
63.601
+14.327
29.08%
jan 1, 1984
56.25
-7.351
-11.56%
jan 1, 1985
77.941
+21.691
38.56%
jan 1, 1986
75.327
-2.614
-3.35%
jan 1, 1987
85.782
+10.455
13.88%
jan 1, 1988
67.801
-17.981
-20.96%
jan 1, 1989
63.609
-4.191
-6.18%
jan 1, 1990
58.827
-4.782
-7.52%
jan 1, 1991
7.418
-51.409
-87.39%
jan 1, 1992
5.433
-1.985
-26.76%
jan 1, 1993
11.22
+5.787
106.5%
jan 1, 1994
11.587
+0.367
3.27%
jan 1, 1995
10.786
-0.801
-6.91%
jan 1, 1996
13.196
+2.41
22.34%
jan 1, 1997
11.497
-1.699
-12.87%
jan 1, 1998
9.224
-2.273
-19.77%
jan 1, 1999
13.725
+4.501
48.8%
jan 1, 2000
8.521
-5.203
-37.91%
jan 1, 2001
12.933
+4.411
51.76%
jan 1, 2002
14.03
+1.098
8.49%
jan 1, 2003
15.135
+1.105
7.87%
jan 1, 2004
10.585
-4.55
-30.06%
jan 1, 2005
31.633
+21.048
198.85%
jan 1, 2006
28.434
-3.198
-10.11%
jan 1, 2007
27.276
-1.158
-4.07%
jan 1, 2008
27.37
+0.094
0.34%
jan 1, 2009
27.399
+0.029
0.11%
jan 1, 2010
28.879
+1.48
5.4%
jan 1, 2011
27.511
-1.367
-4.73%
jan 1, 2012
35.733
+8.221
29.88%
jan 1, 2013
31.466
-4.267
-11.94%
jan 1, 2014
31.295
-0.17
-0.54%
jan 1, 2015
30.343
-0.952
-3.04%
Ranking of countries by current statistics by years


Comments: