29
/
en
AIzaSyAYiBZKx7MnpbEhh9jyipgxe19OcubqV5w
April 1, 2024
162342
Jamaica
JAM
true
2
1
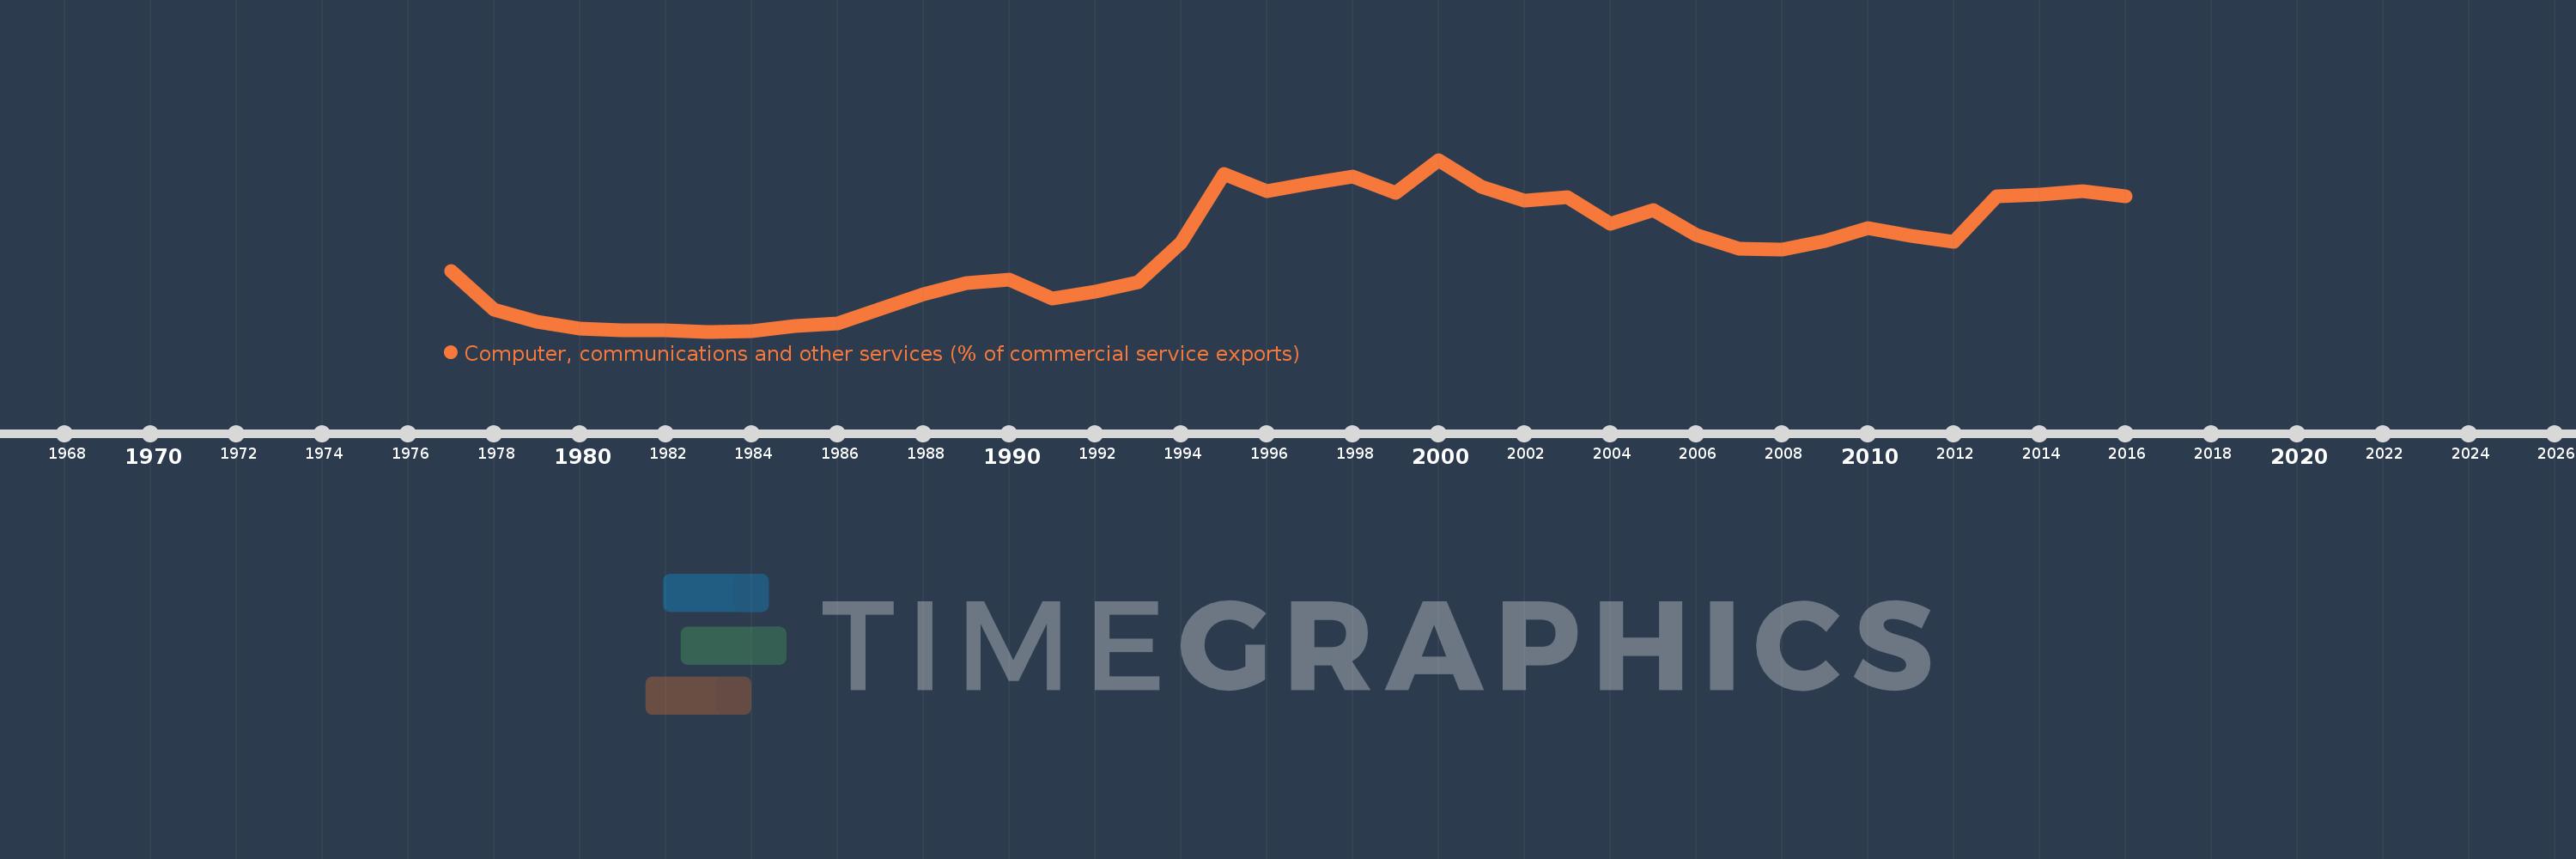
Computer, communications and other services (% of commercial service exports)
2016,2015,2014,2013,2012,2011,2010,2009,2008,2007,2006,2005,2004,2003,2002,2001,2000,1999,1998,1997,1996,1995,1994,1993,1992,1991,1990,1989,1988,1987,1986,1985,1984,1983,1982,1981,1980,1979,1978,1977
This statistics in other country:
AfghanistanAlbaniaAlgeriaAngolaAntigua and BarbudaArab WorldArgentinaArmeniaArubaAustraliaAustriaAzerbaijanBahamas, TheBahrainBangladeshBarbadosBelarusBelgiumBelizeBeninBermudaBhutanBoliviaBosnia and HerzegovinaBotswanaBrazilBrunei DarussalamBulgariaBurkina FasoBurundiCabo VerdeCambodiaCameroonCanadaCaribbean small statesCentral African RepublicCentral Europe and the BalticsChadChileChinaColombiaComorosCongo, Dem. Rep.Congo, Rep.Costa RicaCote d'IvoireCroatiaCuracaoCyprusCzech RepublicDenmarkDjiboutiDominicaDominican RepublicEarly-demographic dividendEast Asia & PacificEast Asia & Pacific (excluding high income)East Asia & Pacific (IDA & IBRD countries)EcuadorEgypt, Arab Rep.El SalvadorEritreaEstoniaEthiopiaEuro areaEurope & Central AsiaEurope & Central Asia (excluding high income)Europe & Central Asia (IDA & IBRD countries)European UnionFaroe IslandsFijiFinlandFragile and conflict affected situationsFranceFrench PolynesiaGabonGambia, TheGeorgiaGermanyGhanaGreeceGrenadaGuatemalaGuineaGuinea-BissauGuyanaHaitiHeavily indebted poor countries (HIPC)High incomeHondurasHong Kong SAR, ChinaHungaryIBRD onlyIcelandIDA & IBRD totalIDA onlyIDA totalIndiaIndonesiaIran, Islamic Rep.IraqIrelandIsraelItalyJamaicaJapanJordanKazakhstanKenyaKiribatiKorea, Rep.KosovoKuwaitKyrgyz RepublicLao PDRLate-demographic dividendLatin America & Caribbean Latin America & Caribbean (excluding high income)Latin America & the Caribbean (IDA & IBRD countries)LatviaLeast developed countries: UN classificationLebanonLesothoLiberiaLibyaLithuaniaLow & middle incomeLow incomeLower middle incomeLuxembourgMacao SAR, ChinaMacedonia, FYRMadagascarMalawiMalaysiaMaldivesMaliMaltaMarshall IslandsMauritaniaMauritiusMexicoMicronesia, Fed. Sts.Middle East & North AfricaMiddle East & North Africa (excluding high income)Middle East & North Africa (IDA & IBRD countries)Middle incomeMoldovaMongoliaMontenegroMoroccoMozambiqueMyanmarNamibiaNepalNetherlandsNew CaledoniaNew ZealandNicaraguaNigerNigeriaNorth AmericaNorwayOECD membersOmanOther small statesPacific island small statesPakistanPalauPanamaPapua New GuineaParaguayPeruPhilippinesPolandPortugalPost-demographic dividendPre-demographic dividendQatarRomaniaRussian FederationRwandaSamoaSao Tome and PrincipeSaudi ArabiaSenegalSerbiaSeychellesSierra LeoneSingaporeSint Maarten (Dutch part)Slovak RepublicSloveniaSmall statesSolomon IslandsSouth AfricaSouth AsiaSouth Asia (IDA & IBRD)South SudanSpainSri LankaSt. Kitts and NevisSt. LuciaSt. Vincent and the GrenadinesSub-Saharan Africa Sub-Saharan Africa (excluding high income)Sub-Saharan Africa (IDA & IBRD countries)SudanSurinameSwazilandSwedenSwitzerlandSyrian Arab RepublicTajikistanTanzaniaThailandTimor-LesteTogoTongaTrinidad and TobagoTunisiaTurkeyTuvaluUgandaUkraineUnited KingdomUnited StatesUpper middle incomeUruguayVanuatuVenezuela, RBWest Bank and GazaWorldYemen, Rep.ZambiaZimbabwe Timeline:
This timeline shows a graph from 1977 to 2016 of Jamaica. No data until 1976. Number of actual observations by date: 40.
Source name:
World Development Indicators
Source organization:
International Monetary Fund, Balance of Payments Statistics Yearbook and data files.
Categories, topics:
Private Sector, Trade
Last updated:
apr 23, 2017
Indicators value changes by year
Maximum:
18.038
jan 1, 2000
At the date of observation
Value
Absolute change
Change from previous value
jan 1, 1977
6.469
+6.469
0.0%
jan 1, 1978
2.437
-4.032
-62.33%
jan 1, 1979
1.224
-1.213
-49.77%
jan 1, 1980
0.484
-0.74
-60.46%
jan 1, 1981
0.32
-0.164
-33.9%
jan 1, 1982
0.296
-0.024
-7.45%
jan 1, 1983
0.172
-0.124
-41.9%
jan 1, 1984
0.231
+0.059
34.14%
jan 1, 1985
0.715
+0.484
209.98%
jan 1, 1986
1.065
+0.349
48.85%
jan 1, 1987
2.545
+1.481
139.08%
jan 1, 1988
4.036
+1.491
58.58%
jan 1, 1989
5.227
+1.191
29.51%
jan 1, 1990
5.55
+0.322
6.17%
jan 1, 1991
3.567
-1.982
-35.72%
jan 1, 1992
4.305
+0.737
20.67%
jan 1, 1993
5.282
+0.977
22.7%
jan 1, 1994
9.388
+4.106
77.74%
jan 1, 1995
16.522
+7.134
75.99%
jan 1, 1996
14.736
-1.786
-10.81%
jan 1, 1997
15.608
+0.872
5.92%
jan 1, 1998
16.288
+0.68
4.36%
jan 1, 1999
14.625
-1.663
-10.21%
jan 1, 2000
18.038
+3.413
23.34%
jan 1, 2001
15.2
-2.838
-15.73%
jan 1, 2002
13.758
-1.443
-9.49%
jan 1, 2003
14.13
+0.372
2.7%
jan 1, 2004
11.384
-2.745
-19.43%
jan 1, 2005
12.832
+1.448
12.72%
jan 1, 2006
10.228
-2.604
-20.29%
jan 1, 2007
8.809
-1.419
-13.87%
jan 1, 2008
8.734
-0.076
-0.86%
jan 1, 2009
9.591
+0.857
9.81%
jan 1, 2010
10.892
+1.301
13.57%
jan 1, 2011
10.163
-0.729
-6.69%
jan 1, 2012
9.506
-0.658
-6.47%
jan 1, 2013
14.239
+4.733
49.79%
jan 1, 2014
14.452
+0.213
1.5%
jan 1, 2015
14.811
+0.359
2.48%
jan 1, 2016
14.219
-0.592
-4.0%
Ranking of countries by current statistics by years


Comments: