29
/
en
AIzaSyAYiBZKx7MnpbEhh9jyipgxe19OcubqV5w
April 1, 2024
258131
Syrian Arab Republic
SYR
true
2
1
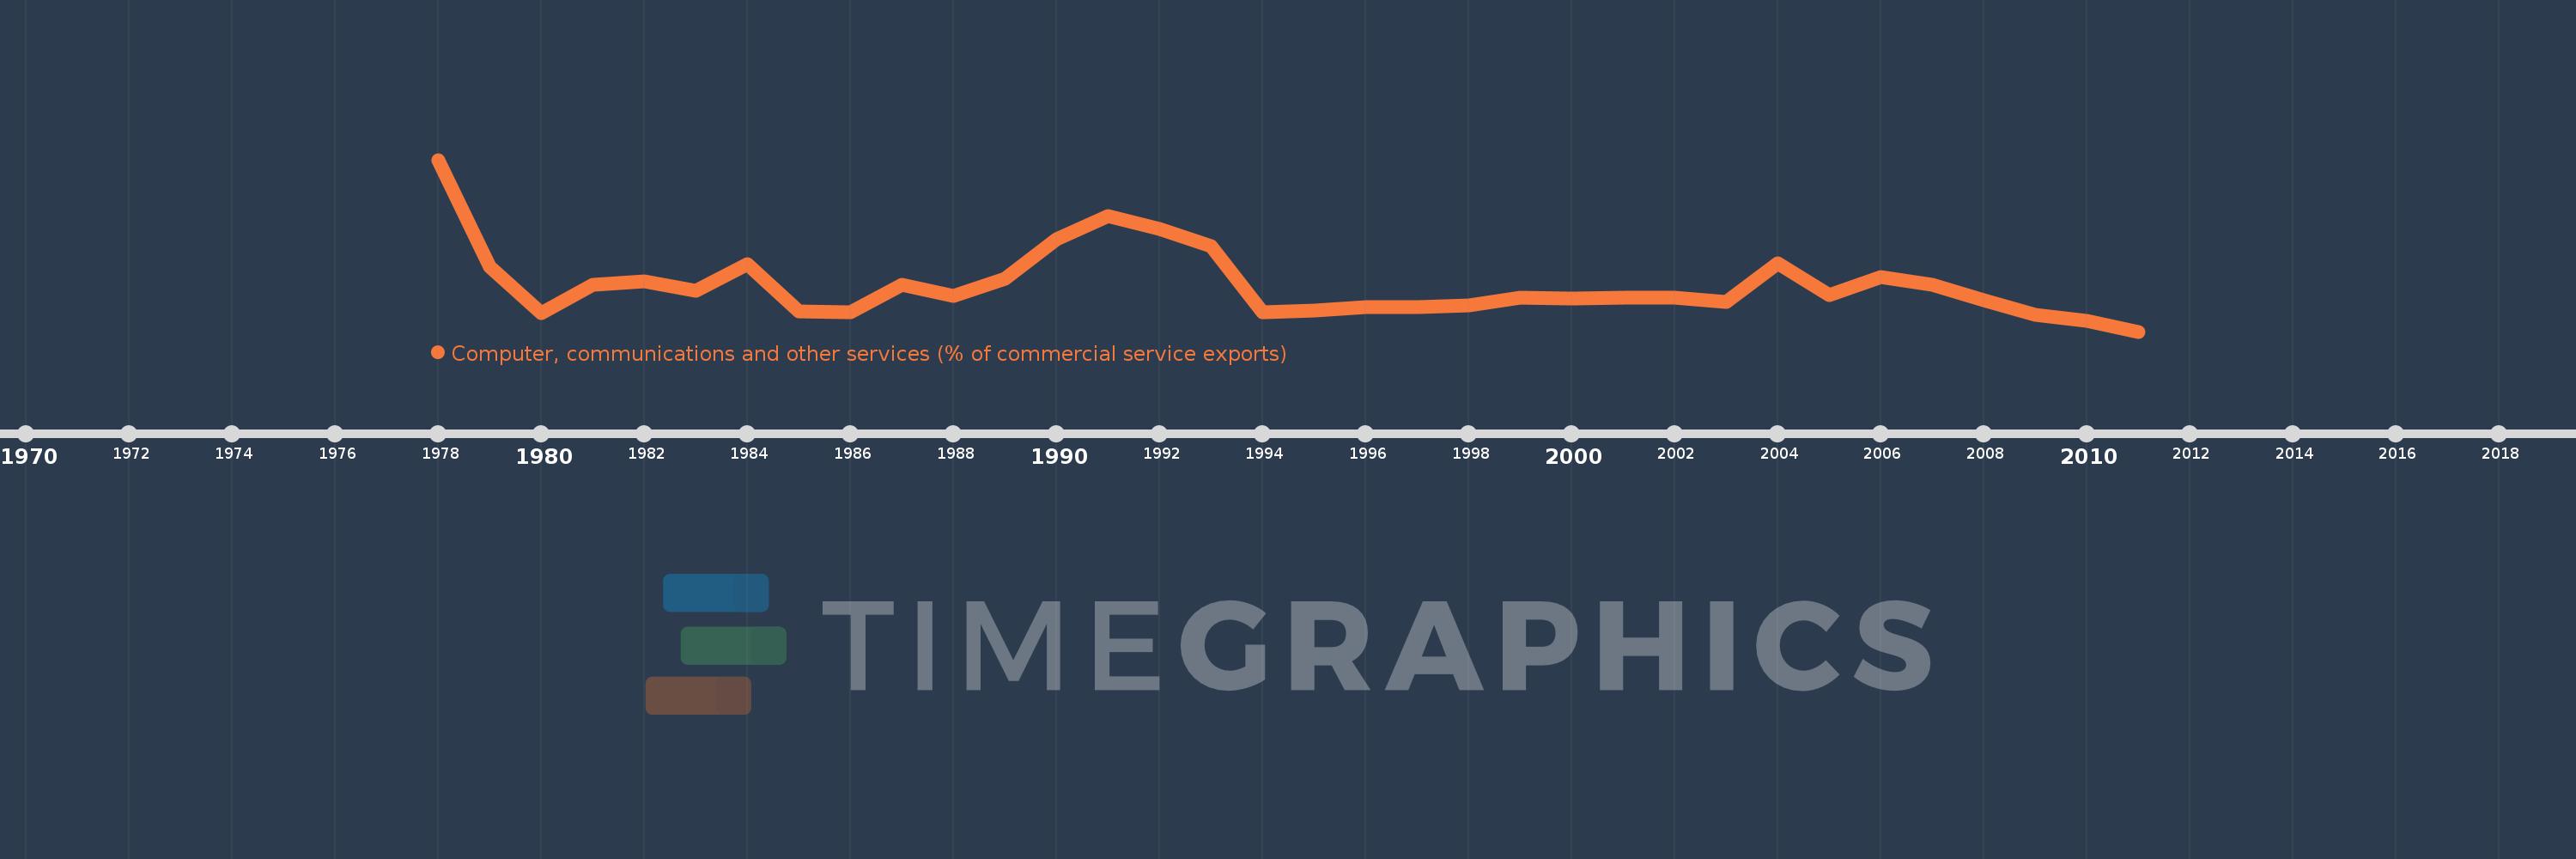
Computer, communications and other services (% of commercial service exports)
2011,2010,2009,2008,2007,2006,2005,2004,2003,2002,2001,2000,1999,1998,1997,1996,1995,1994,1993,1992,1991,1990,1989,1988,1987,1986,1985,1984,1983,1982,1981,1980,1979,1978
This statistics in other country:
AfghanistanAlbaniaAlgeriaAngolaAntigua and BarbudaArab WorldArgentinaArmeniaArubaAustraliaAustriaAzerbaijanBahamas, TheBahrainBangladeshBarbadosBelarusBelgiumBelizeBeninBermudaBhutanBoliviaBosnia and HerzegovinaBotswanaBrazilBrunei DarussalamBulgariaBurkina FasoBurundiCabo VerdeCambodiaCameroonCanadaCaribbean small statesCentral African RepublicCentral Europe and the BalticsChadChileChinaColombiaComorosCongo, Dem. Rep.Congo, Rep.Costa RicaCote d'IvoireCroatiaCuracaoCyprusCzech RepublicDenmarkDjiboutiDominicaDominican RepublicEarly-demographic dividendEast Asia & PacificEast Asia & Pacific (excluding high income)East Asia & Pacific (IDA & IBRD countries)EcuadorEgypt, Arab Rep.El SalvadorEritreaEstoniaEthiopiaEuro areaEurope & Central AsiaEurope & Central Asia (excluding high income)Europe & Central Asia (IDA & IBRD countries)European UnionFaroe IslandsFijiFinlandFragile and conflict affected situationsFranceFrench PolynesiaGabonGambia, TheGeorgiaGermanyGhanaGreeceGrenadaGuatemalaGuineaGuinea-BissauGuyanaHaitiHeavily indebted poor countries (HIPC)High incomeHondurasHong Kong SAR, ChinaHungaryIBRD onlyIcelandIDA & IBRD totalIDA onlyIDA totalIndiaIndonesiaIran, Islamic Rep.IraqIrelandIsraelItalyJamaicaJapanJordanKazakhstanKenyaKiribatiKorea, Rep.KosovoKuwaitKyrgyz RepublicLao PDRLate-demographic dividendLatin America & Caribbean Latin America & Caribbean (excluding high income)Latin America & the Caribbean (IDA & IBRD countries)LatviaLeast developed countries: UN classificationLebanonLesothoLiberiaLibyaLithuaniaLow & middle incomeLow incomeLower middle incomeLuxembourgMacao SAR, ChinaMacedonia, FYRMadagascarMalawiMalaysiaMaldivesMaliMaltaMarshall IslandsMauritaniaMauritiusMexicoMicronesia, Fed. Sts.Middle East & North AfricaMiddle East & North Africa (excluding high income)Middle East & North Africa (IDA & IBRD countries)Middle incomeMoldovaMongoliaMontenegroMoroccoMozambiqueMyanmarNamibiaNepalNetherlandsNew CaledoniaNew ZealandNicaraguaNigerNigeriaNorth AmericaNorwayOECD membersOmanOther small statesPacific island small statesPakistanPalauPanamaPapua New GuineaParaguayPeruPhilippinesPolandPortugalPost-demographic dividendPre-demographic dividendQatarRomaniaRussian FederationRwandaSamoaSao Tome and PrincipeSaudi ArabiaSenegalSerbiaSeychellesSierra LeoneSingaporeSint Maarten (Dutch part)Slovak RepublicSloveniaSmall statesSolomon IslandsSouth AfricaSouth AsiaSouth Asia (IDA & IBRD)South SudanSpainSri LankaSt. Kitts and NevisSt. LuciaSt. Vincent and the GrenadinesSub-Saharan Africa Sub-Saharan Africa (excluding high income)Sub-Saharan Africa (IDA & IBRD countries)SudanSurinameSwazilandSwedenSwitzerlandSyrian Arab RepublicTajikistanTanzaniaThailandTimor-LesteTogoTongaTrinidad and TobagoTunisiaTurkeyTuvaluUgandaUkraineUnited KingdomUnited StatesUpper middle incomeUruguayVanuatuVenezuela, RBWest Bank and GazaWorldYemen, Rep.ZambiaZimbabwe Timeline:
This timeline shows a graph from 1978 to 2011 of Syrian Arab Republic. No data until 1977. Number of actual observations by date: 34.
Source name:
World Development Indicators
Source organization:
International Monetary Fund, Balance of Payments Statistics Yearbook and data files.
Categories, topics:
Private Sector, Trade
Last updated:
apr 23, 2017
Indicators value changes by year
Maximum:
38.333
jan 1, 1978
At the date of observation
Value
Absolute change
Change from previous value
jan 1, 1978
38.333
+38.333
0.0%
jan 1, 1979
16.566
-21.768
-56.78%
jan 1, 1980
7.161
-9.405
-56.77%
jan 1, 1981
12.872
+5.711
79.75%
jan 1, 1982
13.605
+0.733
5.69%
jan 1, 1983
11.638
-1.967
-14.46%
jan 1, 1984
17.122
+5.484
47.13%
jan 1, 1985
7.572
-9.55
-55.78%
jan 1, 1986
7.315
-0.257
-3.39%
jan 1, 1987
12.881
+5.566
76.09%
jan 1, 1988
10.596
-2.285
-17.74%
jan 1, 1989
14.205
+3.609
34.06%
jan 1, 1990
22.14
+7.935
55.87%
jan 1, 1991
26.988
+4.848
21.9%
jan 1, 1992
24.339
-2.649
-9.82%
jan 1, 1993
20.715
-3.623
-14.89%
jan 1, 1994
7.303
-13.412
-64.75%
jan 1, 1995
7.735
+0.432
5.92%
jan 1, 1996
8.395
+0.659
8.53%
jan 1, 1997
8.442
+0.047
0.56%
jan 1, 1998
8.705
+0.264
3.12%
jan 1, 1999
10.408
+1.703
19.56%
jan 1, 2000
10.177
-0.231
-2.22%
jan 1, 2001
10.338
+0.161
1.58%
jan 1, 2002
10.281
-0.057
-0.55%
jan 1, 2003
9.428
-0.853
-8.29%
jan 1, 2004
17.29
+7.862
83.38%
jan 1, 2005
10.84
-6.45
-37.3%
jan 1, 2006
14.453
+3.613
33.33%
jan 1, 2007
12.948
-1.505
-10.41%
jan 1, 2008
9.8
-3.149
-24.32%
jan 1, 2009
6.778
-3.021
-30.83%
jan 1, 2010
5.651
-1.127
-16.63%
jan 1, 2011
3.432
-2.22
-39.27%
Ranking of countries by current statistics by years


Comments: