29
/
en
AIzaSyAYiBZKx7MnpbEhh9jyipgxe19OcubqV5w
April 1, 2024
131804
Fiji
FJI
true
2
1
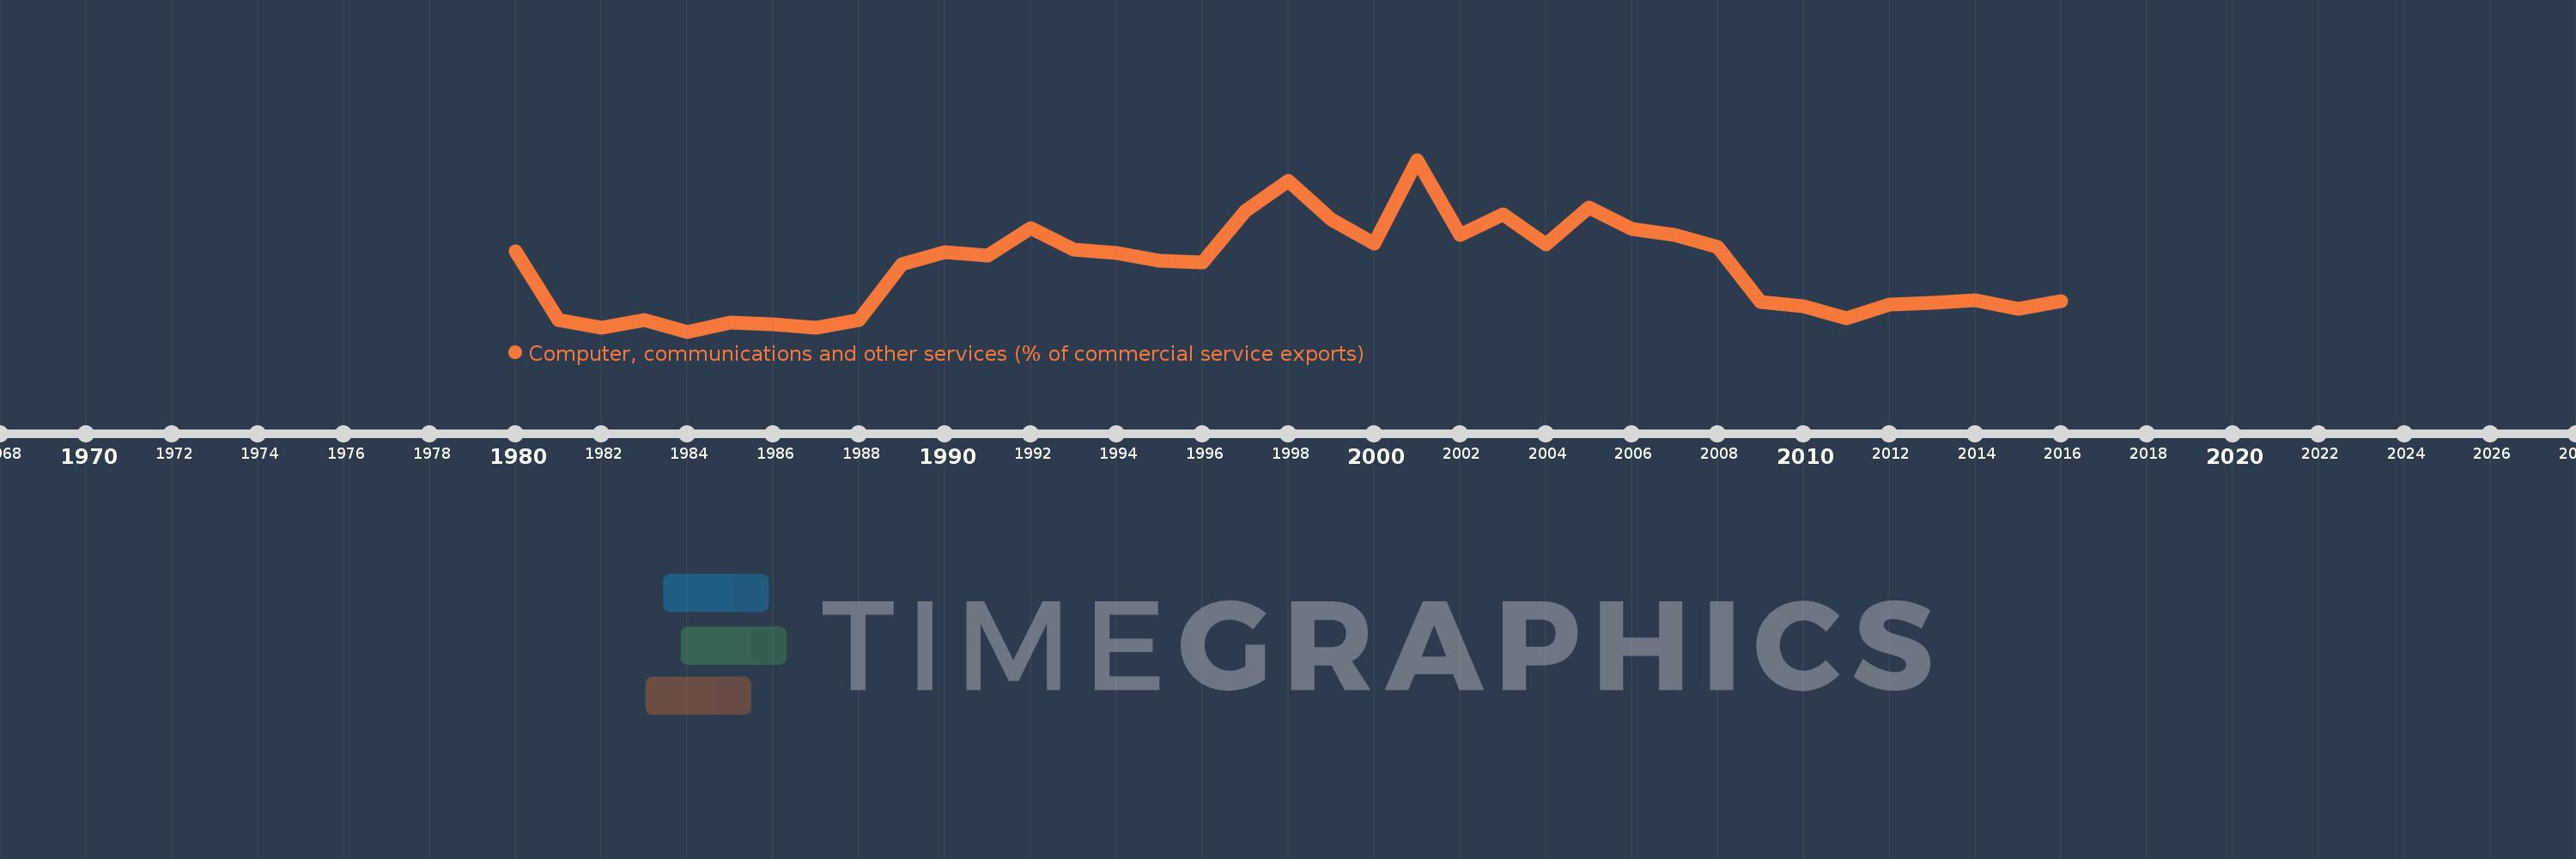
Computer, communications and other services (% of commercial service exports)
2016,2015,2014,2013,2012,2011,2010,2009,2008,2007,2006,2005,2004,2003,2002,2001,2000,1999,1998,1997,1996,1995,1994,1993,1992,1991,1990,1989,1988,1987,1986,1985,1984,1983,1982,1981,1980
This statistics in other country:
AfghanistanAlbaniaAlgeriaAngolaAntigua and BarbudaArab WorldArgentinaArmeniaArubaAustraliaAustriaAzerbaijanBahamas, TheBahrainBangladeshBarbadosBelarusBelgiumBelizeBeninBermudaBhutanBoliviaBosnia and HerzegovinaBotswanaBrazilBrunei DarussalamBulgariaBurkina FasoBurundiCabo VerdeCambodiaCameroonCanadaCaribbean small statesCentral African RepublicCentral Europe and the BalticsChadChileChinaColombiaComorosCongo, Dem. Rep.Congo, Rep.Costa RicaCote d'IvoireCroatiaCuracaoCyprusCzech RepublicDenmarkDjiboutiDominicaDominican RepublicEarly-demographic dividendEast Asia & PacificEast Asia & Pacific (excluding high income)East Asia & Pacific (IDA & IBRD countries)EcuadorEgypt, Arab Rep.El SalvadorEritreaEstoniaEthiopiaEuro areaEurope & Central AsiaEurope & Central Asia (excluding high income)Europe & Central Asia (IDA & IBRD countries)European UnionFaroe IslandsFijiFinlandFragile and conflict affected situationsFranceFrench PolynesiaGabonGambia, TheGeorgiaGermanyGhanaGreeceGrenadaGuatemalaGuineaGuinea-BissauGuyanaHaitiHeavily indebted poor countries (HIPC)High incomeHondurasHong Kong SAR, ChinaHungaryIBRD onlyIcelandIDA & IBRD totalIDA onlyIDA totalIndiaIndonesiaIran, Islamic Rep.IraqIrelandIsraelItalyJamaicaJapanJordanKazakhstanKenyaKiribatiKorea, Rep.KosovoKuwaitKyrgyz RepublicLao PDRLate-demographic dividendLatin America & Caribbean Latin America & Caribbean (excluding high income)Latin America & the Caribbean (IDA & IBRD countries)LatviaLeast developed countries: UN classificationLebanonLesothoLiberiaLibyaLithuaniaLow & middle incomeLow incomeLower middle incomeLuxembourgMacao SAR, ChinaMacedonia, FYRMadagascarMalawiMalaysiaMaldivesMaliMaltaMarshall IslandsMauritaniaMauritiusMexicoMicronesia, Fed. Sts.Middle East & North AfricaMiddle East & North Africa (excluding high income)Middle East & North Africa (IDA & IBRD countries)Middle incomeMoldovaMongoliaMontenegroMoroccoMozambiqueMyanmarNamibiaNepalNetherlandsNew CaledoniaNew ZealandNicaraguaNigerNigeriaNorth AmericaNorwayOECD membersOmanOther small statesPacific island small statesPakistanPalauPanamaPapua New GuineaParaguayPeruPhilippinesPolandPortugalPost-demographic dividendPre-demographic dividendQatarRomaniaRussian FederationRwandaSamoaSao Tome and PrincipeSaudi ArabiaSenegalSerbiaSeychellesSierra LeoneSingaporeSint Maarten (Dutch part)Slovak RepublicSloveniaSmall statesSolomon IslandsSouth AfricaSouth AsiaSouth Asia (IDA & IBRD)South SudanSpainSri LankaSt. Kitts and NevisSt. LuciaSt. Vincent and the GrenadinesSub-Saharan Africa Sub-Saharan Africa (excluding high income)Sub-Saharan Africa (IDA & IBRD countries)SudanSurinameSwazilandSwedenSwitzerlandSyrian Arab RepublicTajikistanTanzaniaThailandTimor-LesteTogoTongaTrinidad and TobagoTunisiaTurkeyTuvaluUgandaUkraineUnited KingdomUnited StatesUpper middle incomeUruguayVanuatuVenezuela, RBWest Bank and GazaWorldYemen, Rep.ZambiaZimbabwe Timeline:
This timeline shows a graph from 1980 to 2016 of Fiji. No data until 1979. Number of actual observations by date: 37.
Source name:
World Development Indicators
Source organization:
International Monetary Fund, Balance of Payments Statistics Yearbook and data files.
Categories, topics:
Private Sector, Trade
Last updated:
apr 23, 2017
Indicators value changes by year
Maximum:
22.284
jan 1, 2001
At the date of observation
Value
Absolute change
Change from previous value
jan 1, 1980
12.004
+12.004
0.0%
jan 1, 1981
4.244
-7.76
-64.65%
jan 1, 1982
3.344
-0.899
-21.19%
jan 1, 1983
4.251
+0.907
27.11%
jan 1, 1984
2.901
-1.35
-31.75%
jan 1, 1985
3.913
+1.011
34.86%
jan 1, 1986
3.725
-0.188
-4.81%
jan 1, 1987
3.308
-0.417
-11.18%
jan 1, 1988
4.206
+0.898
27.14%
jan 1, 1989
10.523
+6.317
150.19%
jan 1, 1990
11.841
+1.319
12.53%
jan 1, 1991
11.458
-0.384
-3.24%
jan 1, 1992
14.536
+3.079
26.87%
jan 1, 1993
12.118
-2.419
-16.64%
jan 1, 1994
11.764
-0.354
-2.92%
jan 1, 1995
10.905
-0.859
-7.3%
jan 1, 1996
10.715
-0.19
-1.74%
jan 1, 1997
16.562
+5.847
54.57%
jan 1, 1998
19.87
+3.308
19.97%
jan 1, 1999
15.509
-4.36
-21.94%
jan 1, 2000
12.877
-2.632
-16.97%
jan 1, 2001
22.284
+9.406
73.05%
jan 1, 2002
13.845
-8.438
-37.87%
jan 1, 2003
16.142
+2.296
16.58%
jan 1, 2004
12.748
-3.393
-21.02%
jan 1, 2005
16.948
+4.199
32.94%
jan 1, 2006
14.439
-2.508
-14.8%
jan 1, 2007
13.809
-0.63
-4.36%
jan 1, 2008
12.421
-1.389
-10.06%
jan 1, 2009
6.205
-6.216
-50.05%
jan 1, 2010
5.753
-0.451
-7.27%
jan 1, 2011
4.397
-1.356
-23.58%
jan 1, 2012
5.989
+1.593
36.22%
jan 1, 2013
6.174
+0.185
3.08%
jan 1, 2014
6.467
+0.293
4.74%
jan 1, 2015
5.475
-0.992
-15.34%
jan 1, 2016
6.357
+0.883
16.12%
Ranking of countries by current statistics by years


Comments: