29
/
en
AIzaSyAYiBZKx7MnpbEhh9jyipgxe19OcubqV5w
April 1, 2024
64463
Albania
ALB
true
2
1
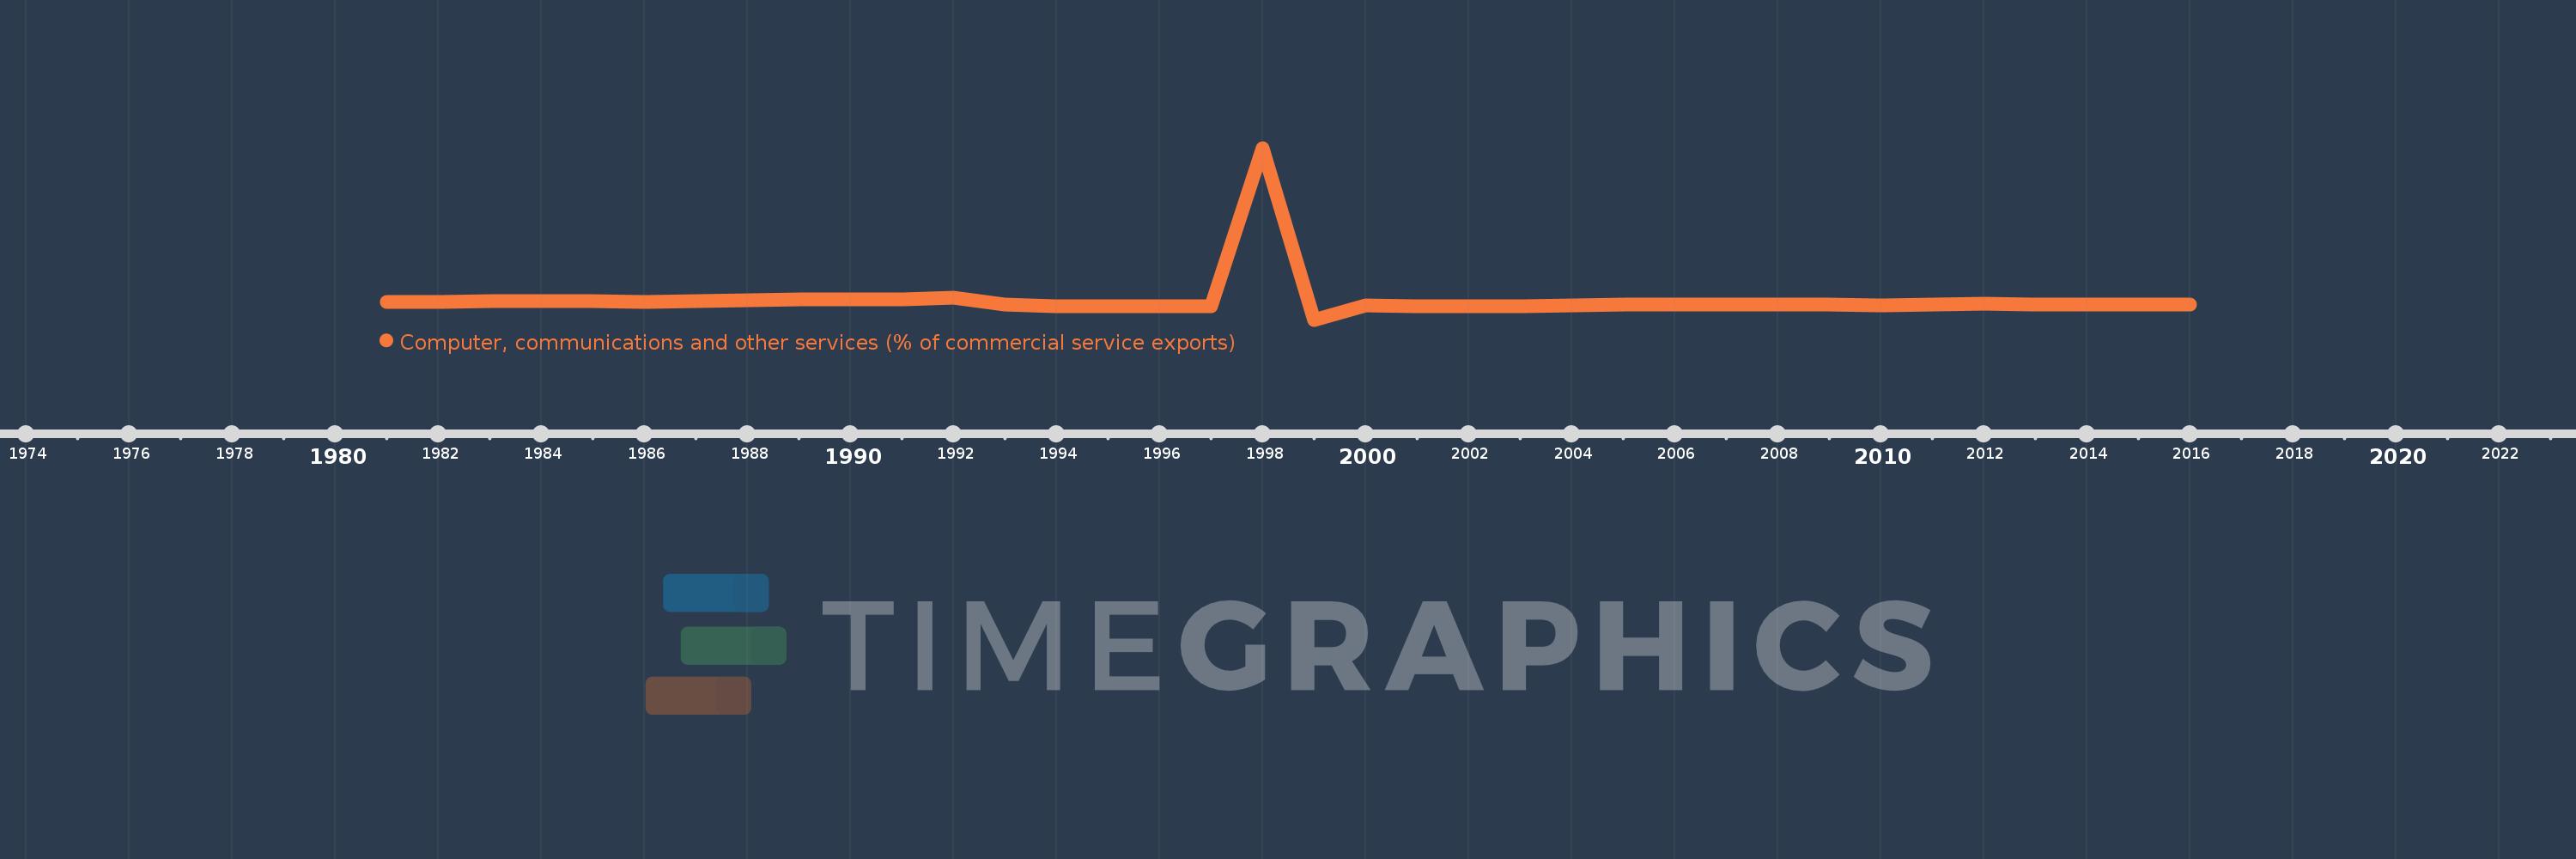
Computer, communications and other services (% of commercial service exports)
2016,2015,2014,2013,2012,2011,2010,2009,2008,2007,2006,2005,2004,2003,2002,2001,2000,1999,1998,1997,1996,1995,1994,1993,1992,1991,1990,1989,1988,1987,1986,1985,1984,1983,1982,1981
This statistics in other country:
AfghanistanAlbaniaAlgeriaAngolaAntigua and BarbudaArab WorldArgentinaArmeniaArubaAustraliaAustriaAzerbaijanBahamas, TheBahrainBangladeshBarbadosBelarusBelgiumBelizeBeninBermudaBhutanBoliviaBosnia and HerzegovinaBotswanaBrazilBrunei DarussalamBulgariaBurkina FasoBurundiCabo VerdeCambodiaCameroonCanadaCaribbean small statesCentral African RepublicCentral Europe and the BalticsChadChileChinaColombiaComorosCongo, Dem. Rep.Congo, Rep.Costa RicaCote d'IvoireCroatiaCuracaoCyprusCzech RepublicDenmarkDjiboutiDominicaDominican RepublicEarly-demographic dividendEast Asia & PacificEast Asia & Pacific (excluding high income)East Asia & Pacific (IDA & IBRD countries)EcuadorEgypt, Arab Rep.El SalvadorEritreaEstoniaEthiopiaEuro areaEurope & Central AsiaEurope & Central Asia (excluding high income)Europe & Central Asia (IDA & IBRD countries)European UnionFaroe IslandsFijiFinlandFragile and conflict affected situationsFranceFrench PolynesiaGabonGambia, TheGeorgiaGermanyGhanaGreeceGrenadaGuatemalaGuineaGuinea-BissauGuyanaHaitiHeavily indebted poor countries (HIPC)High incomeHondurasHong Kong SAR, ChinaHungaryIBRD onlyIcelandIDA & IBRD totalIDA onlyIDA totalIndiaIndonesiaIran, Islamic Rep.IraqIrelandIsraelItalyJamaicaJapanJordanKazakhstanKenyaKiribatiKorea, Rep.KosovoKuwaitKyrgyz RepublicLao PDRLate-demographic dividendLatin America & Caribbean Latin America & Caribbean (excluding high income)Latin America & the Caribbean (IDA & IBRD countries)LatviaLeast developed countries: UN classificationLebanonLesothoLiberiaLibyaLithuaniaLow & middle incomeLow incomeLower middle incomeLuxembourgMacao SAR, ChinaMacedonia, FYRMadagascarMalawiMalaysiaMaldivesMaliMaltaMarshall IslandsMauritaniaMauritiusMexicoMicronesia, Fed. Sts.Middle East & North AfricaMiddle East & North Africa (excluding high income)Middle East & North Africa (IDA & IBRD countries)Middle incomeMoldovaMongoliaMontenegroMoroccoMozambiqueMyanmarNamibiaNepalNetherlandsNew CaledoniaNew ZealandNicaraguaNigerNigeriaNorth AmericaNorwayOECD membersOmanOther small statesPacific island small statesPakistanPalauPanamaPapua New GuineaParaguayPeruPhilippinesPolandPortugalPost-demographic dividendPre-demographic dividendQatarRomaniaRussian FederationRwandaSamoaSao Tome and PrincipeSaudi ArabiaSenegalSerbiaSeychellesSierra LeoneSingaporeSint Maarten (Dutch part)Slovak RepublicSloveniaSmall statesSolomon IslandsSouth AfricaSouth AsiaSouth Asia (IDA & IBRD)South SudanSpainSri LankaSt. Kitts and NevisSt. LuciaSt. Vincent and the GrenadinesSub-Saharan Africa Sub-Saharan Africa (excluding high income)Sub-Saharan Africa (IDA & IBRD countries)SudanSurinameSwazilandSwedenSwitzerlandSyrian Arab RepublicTajikistanTanzaniaThailandTimor-LesteTogoTongaTrinidad and TobagoTunisiaTurkeyTuvaluUgandaUkraineUnited KingdomUnited StatesUpper middle incomeUruguayVanuatuVenezuela, RBWest Bank and GazaWorldYemen, Rep.ZambiaZimbabwe Timeline:
This timeline shows a graph from 1981 to 2016 of Albania. No data until 1980. Number of actual observations by date: 36.
Source name:
World Development Indicators
Source organization:
International Monetary Fund, Balance of Payments Statistics Yearbook and data files.
Categories, topics:
Private Sector, Trade
Last updated:
apr 23, 2017
Indicators value changes by year
Minimum:
-107.233
jan 1, 1999
Maximum:
1.363K
jan 1, 1998
At the date of observation
Value
Absolute change
Change from previous value
jan 1, 1981
46.789
+46.789
0.0%
jan 1, 1982
44.167
-2.622
-5.6%
jan 1, 1983
49.242
+5.076
11.49%
jan 1, 1984
50.769
+1.527
3.1%
jan 1, 1985
49.351
-1.419
-2.79%
jan 1, 1986
41.333
-8.017
-16.25%
jan 1, 1987
50.625
+9.292
22.48%
jan 1, 1988
56.951
+6.326
12.5%
jan 1, 1989
65.203
+8.252
14.49%
jan 1, 1990
69.9
+4.698
7.2%
jan 1, 1991
66.667
-3.234
-4.63%
jan 1, 1992
79.348
+12.681
19.02%
jan 1, 1993
19.577
-59.771
-75.33%
jan 1, 1994
9.426
-10.15
-51.85%
jan 1, 1995
10.051
+0.625
6.63%
jan 1, 1996
9.798
-0.253
-2.52%
jan 1, 1997
8.958
-0.84
-8.57%
jan 1, 1998
1.363K
+1.354K
15.12K%
jan 1, 1999
-107.233
-1.471K
-107.87%
jan 1, 2000
19.176
+126.409
-117.88%
jan 1, 2001
7.359
-11.818
-61.63%
jan 1, 2002
8.952
+1.593
21.65%
jan 1, 2003
5.903
-3.048
-34.05%
jan 1, 2004
14.716
+8.813
149.28%
jan 1, 2005
22.235
+7.519
51.09%
jan 1, 2006
20.245
-1.99
-8.95%
jan 1, 2007
25.758
+5.513
27.23%
jan 1, 2008
23.835
-1.923
-7.47%
jan 1, 2009
25.005
+1.17
4.91%
jan 1, 2010
18.289
-6.716
-26.86%
jan 1, 2011
26.365
+8.076
44.16%
jan 1, 2012
28.99
+2.625
9.96%
jan 1, 2013
26.43
-2.559
-8.83%
jan 1, 2014
22.452
-3.979
-15.05%
jan 1, 2015
22.277
-0.174
-0.78%
jan 1, 2016
23.863
+1.586
7.12%
Ranking of countries by current statistics by years


Comments: