29
/
en
AIzaSyAYiBZKx7MnpbEhh9jyipgxe19OcubqV5w
April 1, 2024
89601
Botswana
BWA
true
2
1
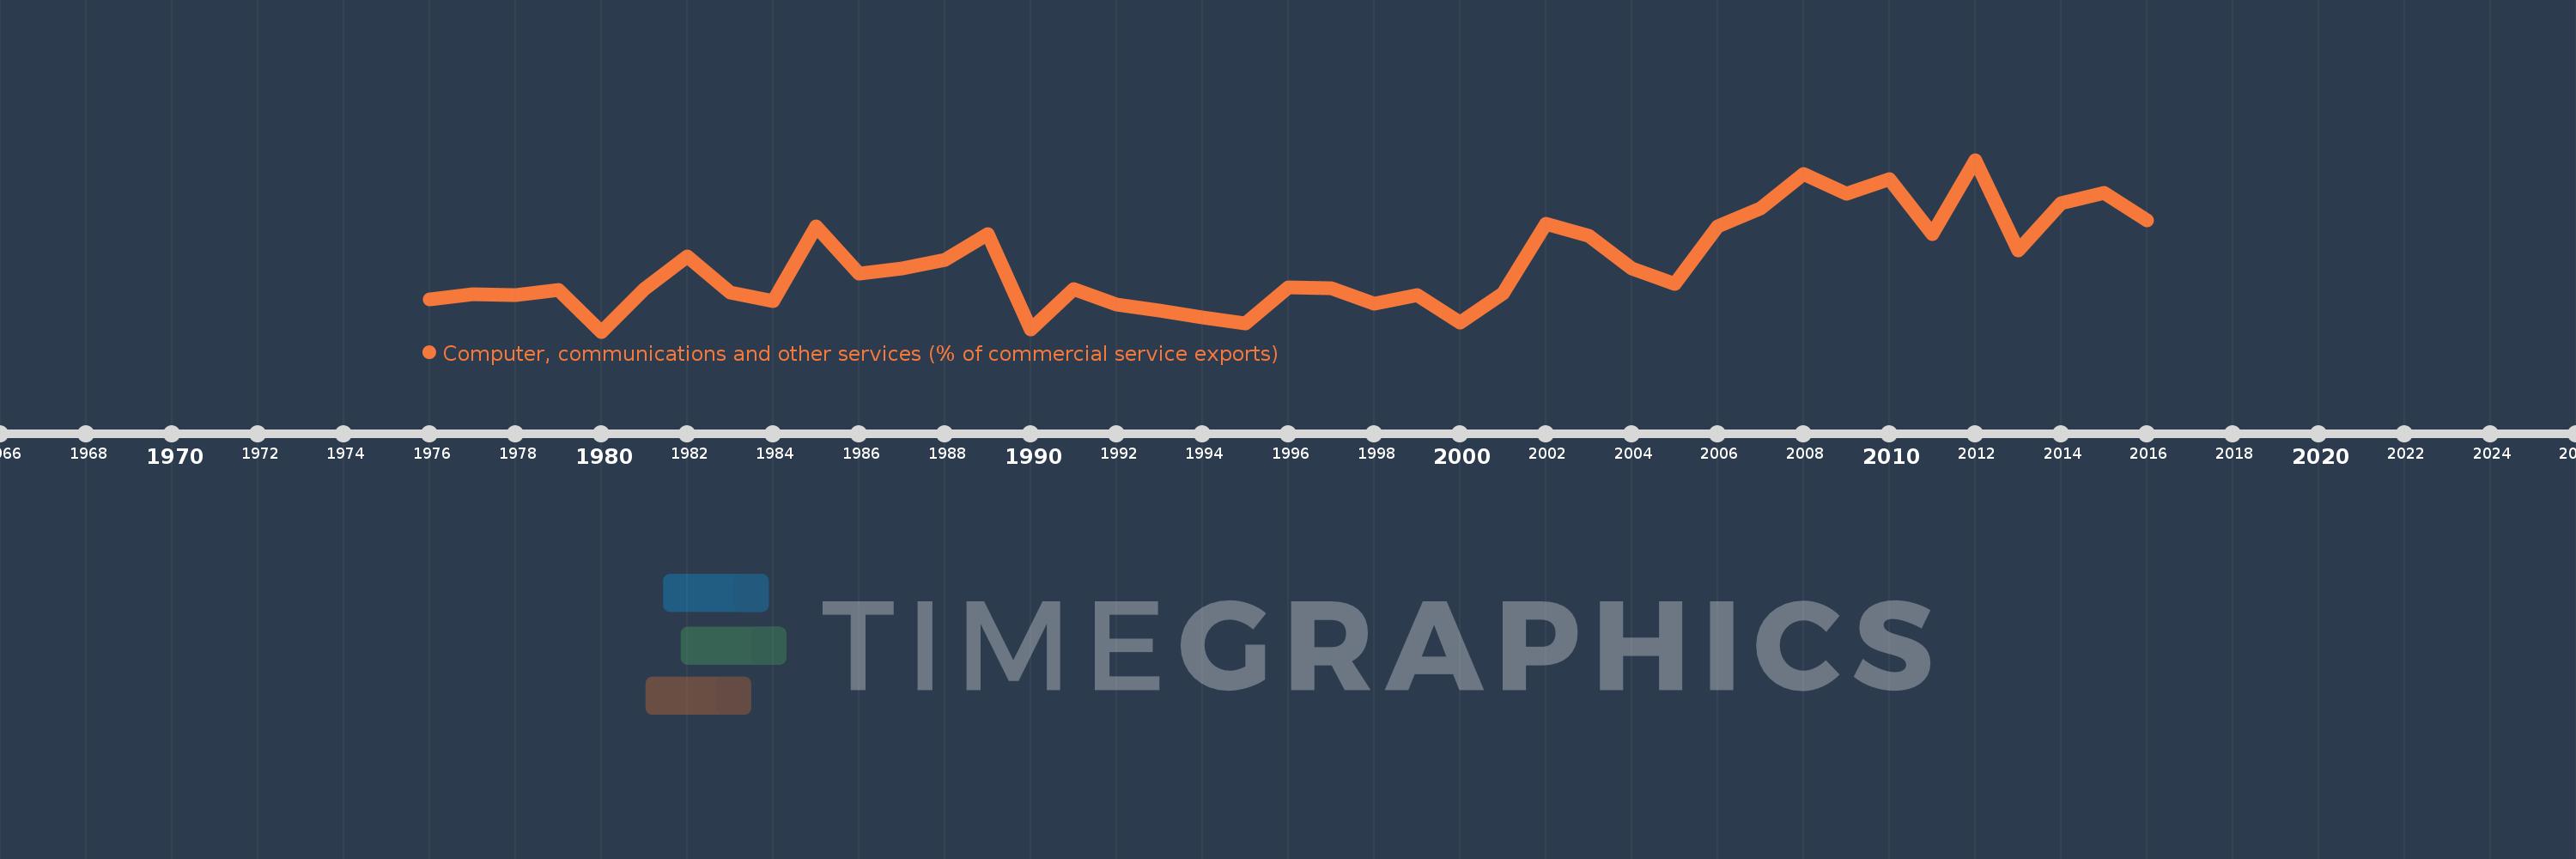
Computer, communications and other services (% of commercial service exports)
2016,2015,2014,2013,2012,2011,2010,2009,2008,2007,2006,2005,2004,2003,2002,2001,2000,1999,1998,1997,1996,1995,1994,1993,1992,1991,1990,1989,1988,1987,1986,1985,1984,1983,1982,1981,1980,1979,1978,1977,1976
This statistics in other country:
AfghanistanAlbaniaAlgeriaAngolaAntigua and BarbudaArab WorldArgentinaArmeniaArubaAustraliaAustriaAzerbaijanBahamas, TheBahrainBangladeshBarbadosBelarusBelgiumBelizeBeninBermudaBhutanBoliviaBosnia and HerzegovinaBotswanaBrazilBrunei DarussalamBulgariaBurkina FasoBurundiCabo VerdeCambodiaCameroonCanadaCaribbean small statesCentral African RepublicCentral Europe and the BalticsChadChileChinaColombiaComorosCongo, Dem. Rep.Congo, Rep.Costa RicaCote d'IvoireCroatiaCuracaoCyprusCzech RepublicDenmarkDjiboutiDominicaDominican RepublicEarly-demographic dividendEast Asia & PacificEast Asia & Pacific (excluding high income)East Asia & Pacific (IDA & IBRD countries)EcuadorEgypt, Arab Rep.El SalvadorEritreaEstoniaEthiopiaEuro areaEurope & Central AsiaEurope & Central Asia (excluding high income)Europe & Central Asia (IDA & IBRD countries)European UnionFaroe IslandsFijiFinlandFragile and conflict affected situationsFranceFrench PolynesiaGabonGambia, TheGeorgiaGermanyGhanaGreeceGrenadaGuatemalaGuineaGuinea-BissauGuyanaHaitiHeavily indebted poor countries (HIPC)High incomeHondurasHong Kong SAR, ChinaHungaryIBRD onlyIcelandIDA & IBRD totalIDA onlyIDA totalIndiaIndonesiaIran, Islamic Rep.IraqIrelandIsraelItalyJamaicaJapanJordanKazakhstanKenyaKiribatiKorea, Rep.KosovoKuwaitKyrgyz RepublicLao PDRLate-demographic dividendLatin America & Caribbean Latin America & Caribbean (excluding high income)Latin America & the Caribbean (IDA & IBRD countries)LatviaLeast developed countries: UN classificationLebanonLesothoLiberiaLibyaLithuaniaLow & middle incomeLow incomeLower middle incomeLuxembourgMacao SAR, ChinaMacedonia, FYRMadagascarMalawiMalaysiaMaldivesMaliMaltaMarshall IslandsMauritaniaMauritiusMexicoMicronesia, Fed. Sts.Middle East & North AfricaMiddle East & North Africa (excluding high income)Middle East & North Africa (IDA & IBRD countries)Middle incomeMoldovaMongoliaMontenegroMoroccoMozambiqueMyanmarNamibiaNepalNetherlandsNew CaledoniaNew ZealandNicaraguaNigerNigeriaNorth AmericaNorwayOECD membersOmanOther small statesPacific island small statesPakistanPalauPanamaPapua New GuineaParaguayPeruPhilippinesPolandPortugalPost-demographic dividendPre-demographic dividendQatarRomaniaRussian FederationRwandaSamoaSao Tome and PrincipeSaudi ArabiaSenegalSerbiaSeychellesSierra LeoneSingaporeSint Maarten (Dutch part)Slovak RepublicSloveniaSmall statesSolomon IslandsSouth AfricaSouth AsiaSouth Asia (IDA & IBRD)South SudanSpainSri LankaSt. Kitts and NevisSt. LuciaSt. Vincent and the GrenadinesSub-Saharan Africa Sub-Saharan Africa (excluding high income)Sub-Saharan Africa (IDA & IBRD countries)SudanSurinameSwazilandSwedenSwitzerlandSyrian Arab RepublicTajikistanTanzaniaThailandTimor-LesteTogoTongaTrinidad and TobagoTunisiaTurkeyTuvaluUgandaUkraineUnited KingdomUnited StatesUpper middle incomeUruguayVanuatuVenezuela, RBWest Bank and GazaWorldYemen, Rep.ZambiaZimbabwe Timeline:
This timeline shows a graph from 1976 to 2016 of Botswana. No data until 1975. Number of actual observations by date: 41.
Source name:
World Development Indicators
Source organization:
International Monetary Fund, Balance of Payments Statistics Yearbook and data files.
Categories, topics:
Private Sector, Trade
Last updated:
apr 23, 2017
Indicators value changes by year
Maximum:
21.009
jan 1, 2012
At the date of observation
Value
Absolute change
Change from previous value
jan 1, 1976
6.14
+6.14
0.0%
jan 1, 1977
6.688
+0.548
8.92%
jan 1, 1978
6.647
-0.041
-0.62%
jan 1, 1979
7.19
+0.543
8.17%
jan 1, 1980
2.752
-4.437
-61.72%
jan 1, 1981
7.304
+4.552
165.39%
jan 1, 1982
10.745
+3.441
47.11%
jan 1, 1983
6.861
-3.884
-36.14%
jan 1, 1984
5.959
-0.903
-13.16%
jan 1, 1985
13.892
+7.933
133.13%
jan 1, 1986
8.954
-4.938
-35.55%
jan 1, 1987
9.499
+0.546
6.09%
jan 1, 1988
10.418
+0.919
9.67%
jan 1, 1989
13.139
+2.721
26.11%
jan 1, 1990
2.97
-10.169
-77.4%
jan 1, 1991
7.313
+4.343
146.25%
jan 1, 1992
5.587
-1.726
-23.61%
jan 1, 1993
4.952
-0.634
-11.36%
jan 1, 1994
4.298
-0.654
-13.2%
jan 1, 1995
3.584
-0.715
-16.63%
jan 1, 1996
7.461
+3.877
108.2%
jan 1, 1997
7.346
-0.115
-1.55%
jan 1, 1998
5.686
-1.659
-22.59%
jan 1, 1999
6.588
+0.902
15.85%
jan 1, 2000
3.734
-2.853
-43.31%
jan 1, 2001
6.849
+3.115
83.41%
jan 1, 2002
14.216
+7.367
107.55%
jan 1, 2003
12.926
-1.29
-9.07%
jan 1, 2004
9.47
-3.456
-26.74%
jan 1, 2005
7.847
-1.622
-17.13%
jan 1, 2006
13.928
+6.081
77.49%
jan 1, 2007
15.834
+1.906
13.68%
jan 1, 2008
19.485
+3.651
23.06%
jan 1, 2009
17.365
-2.119
-10.88%
jan 1, 2010
18.985
+1.619
9.32%
jan 1, 2011
13.113
-5.871
-30.93%
jan 1, 2012
21.009
+7.896
60.21%
jan 1, 2013
11.343
-9.666
-46.01%
jan 1, 2014
16.417
+5.074
44.73%
jan 1, 2015
17.472
+1.055
6.43%
jan 1, 2016
14.568
-2.904
-16.62%
Ranking of countries by current statistics by years


Comments: