29
/
en
AIzaSyAYiBZKx7MnpbEhh9jyipgxe19OcubqV5w
April 1, 2024
76484
Bahamas, The
BHS
true
2
1
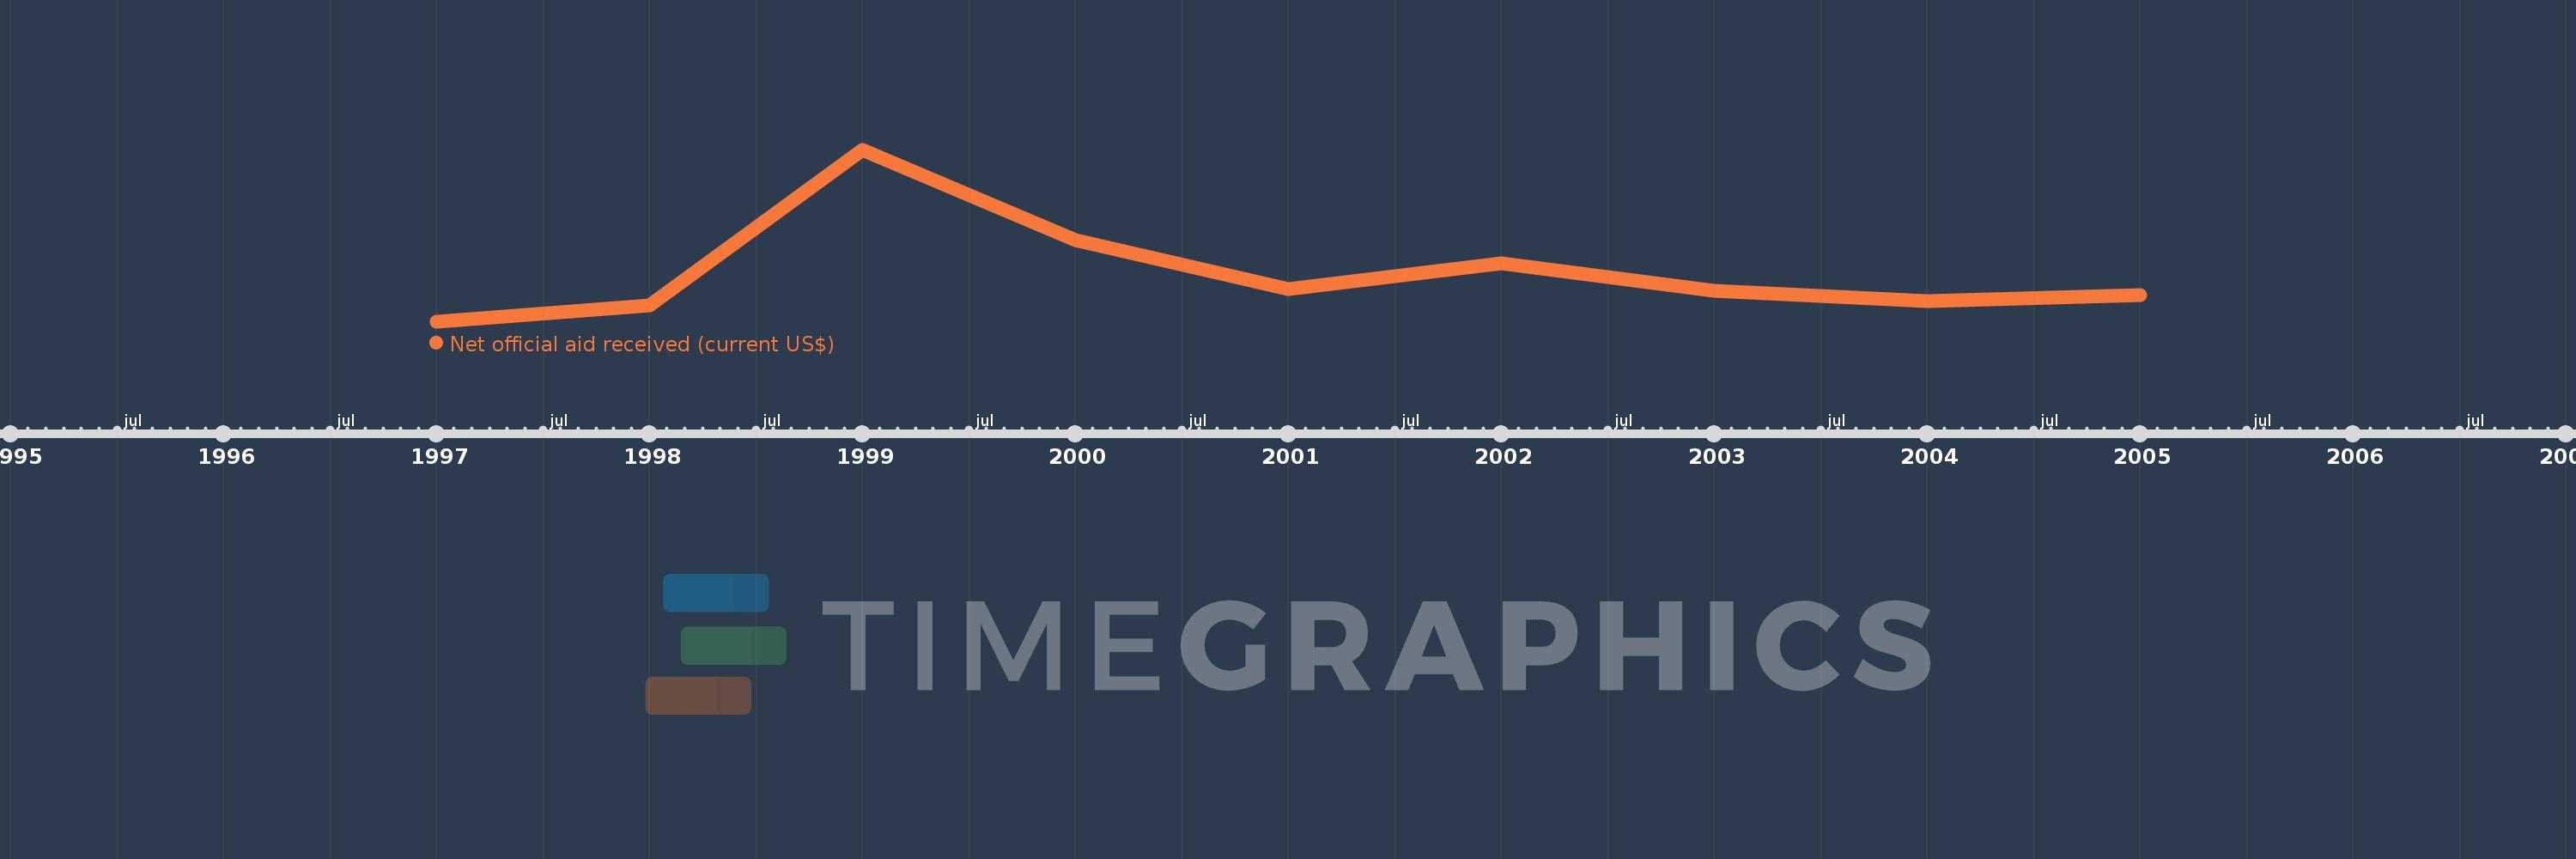
Net official aid received (current US$)
2005,2004,2003,2002,2001,2000,1999,1998,1997
This statistics in other country:
Timeline:
This timeline shows a graph from 1997 to 2005 of Bahamas, The. No data until 1996. Number of actual observations by date: 9.
Source name:
World Development Indicators
Source organization:
Development Assistance Committee of the Organisation for Economic Co-operation and Development, Geographical Distribution of Financial Flows to Developing Countries, Development Co-operation Report, and International Development Statistics database. Data are available online at: www.oecd.org/dac/stats/idsonline.
Categories, topics:
Aid Effectiveness
Last updated:
apr 23, 2017
Indicators value changes by year
Minimum:
1.45 mln
jan 1, 1997
Maximum:
22.61 mln
jan 1, 1999
At the date of observation
Value
Absolute change
Change from previous value
jan 1, 1997
1.45 mln
+1.45 mln
0.0%
jan 1, 1998
3.47 mln
+2.02 mln
139.31%
jan 1, 1999
22.61 mln
+19.14 mln
551.59%
jan 1, 2000
11.56 mln
-11.05 mln
-48.87%
jan 1, 2001
5.47 mln
-6.09 mln
-52.68%
jan 1, 2002
8.68 mln
+3.21 mln
58.68%
jan 1, 2003
5.32 mln
-3.36 mln
-38.71%
jan 1, 2004
4.07 mln
-1.25 mln
-23.5%
jan 1, 2005
4.75 mln
+680.0K
16.71%
Ranking of countries by current statistics by years


Comments: