29
/
en
AIzaSyAYiBZKx7MnpbEhh9jyipgxe19OcubqV5w
April 1, 2024
37631
IDA & IBRD total
IBT
false
2
1
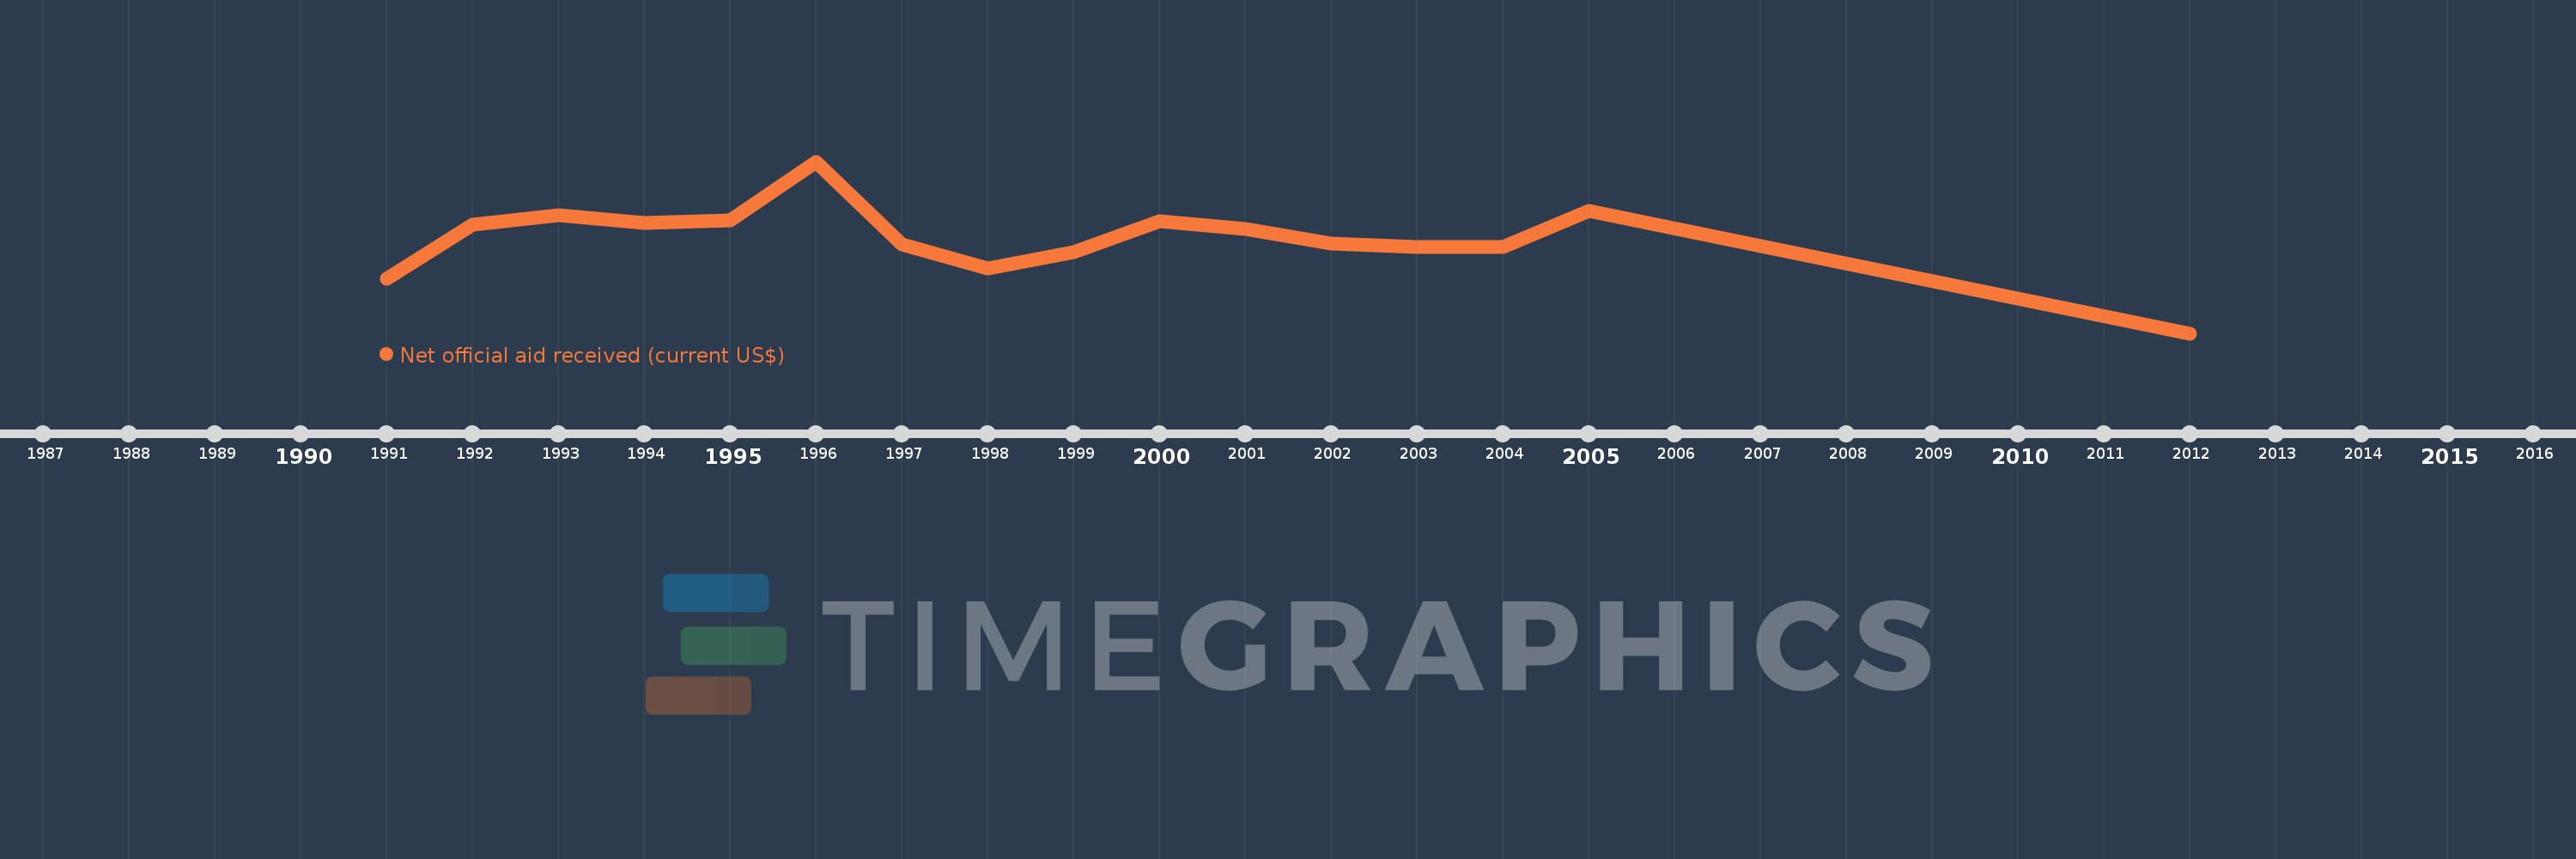
Net official aid received (current US$)
2012,2005,2004,2003,2002,2001,2000,1999,1998,1997,1996,1995,1994,1993,1992,1991
This statistics in other country:
Timeline:
This timeline shows a graph from 1991 to 2012 of IDA & IBRD total. No data until 1990. Number of actual observations by date: 16.
Source name:
World Development Indicators
Source organization:
Development Assistance Committee of the Organisation for Economic Co-operation and Development, Geographical Distribution of Financial Flows to Developing Countries, Development Co-operation Report, and International Development Statistics database. Data are available online at: www.oecd.org/dac/stats/idsonline.
Categories, topics:
Aid Effectiveness
Last updated:
apr 23, 2017
Indicators value changes by year
Minimum:
280.0K
jan 1, 2012
Maximum:
6.724 bln
jan 1, 1996
At the date of observation
Value
Absolute change
Change from previous value
jan 1, 1991
2.12 bln
+2.12 bln
0.0%
jan 1, 1992
4.263 bln
+2.142 bln
101.04%
jan 1, 1993
4.616 bln
+353.44 mln
8.29%
jan 1, 1994
4.315 bln
-301.37 mln
-6.53%
jan 1, 1995
4.431 bln
+116.38 mln
2.7%
jan 1, 1996
6.724 bln
+2.293 bln
51.75%
jan 1, 1997
3.489 bln
-3.235 bln
-48.12%
jan 1, 1998
2.524 bln
-965.25 mln
-27.67%
jan 1, 1999
3.166 bln
+642.55 mln
25.46%
jan 1, 2000
4.376 bln
+1.21 bln
38.22%
jan 1, 2001
4.074 bln
-302.37 mln
-6.91%
jan 1, 2002
3.517 bln
-557.06 mln
-13.67%
jan 1, 2003
3.366 bln
-151.04 mln
-4.29%
jan 1, 2004
3.384 bln
+18.69 mln
0.56%
jan 1, 2005
4.777 bln
+1.393 bln
41.16%
jan 1, 2012
280.0K
-4.777 bln
-99.99%
Ranking of countries by current statistics by years


Comments: